
🏦 Throughout this series, we will use a custom-built creditcards database to explore real-world PostgreSQL performance tuning scenarios, covering performance extensions, execution plans, indexing, statistics, memory tuning, locking and vacuum through hands-on demonstrations.
⚠️ Disclaimer: This guide is provided for educational purposes only and is not intended for production use. These steps were documented and tested in a controlled sandbox environment. Please exercise caution before applying any changes to a production system; the author assumes no responsibility for discrepancies or issues. Use at your own risk.
Pausing/Resuming the Labs:
🛑 Pausing the Labs: If you need to take a break or safely shut down your environment at any point during the course, you can stop both the database and the sandbox environment by running these commands:
# Inside the Linux machine, stop the PostgreSQL instance:
/usr/pgsql-16/bin/pg_ctl stop -D /var/lib/pgsql/postgres-lab01From your host machine (Windows Command Prompt/PowerShell), navigate to your directory path and shut down the VM:
# Change the directory to our labs
cd D:\sandboxes\postgres\postgres-lab01
D:
# halt the environment
vagrant halt🖥️ To Start the Machine again.
From your host machine (Windows Command Prompt/PowerShell), navigate to your directory path and Start up the VM:
# Start the environment
vagrant up# Inside the Linux machine, Start the PostgreSQL instance:
/usr/pgsql-16/bin/pg_ctl start -D /var/lib/pgsql/postgres-lab01🚀 Chapter 1 – Build the PostgreSQL Sandbox
🚀 Chapter 1 – Build the PostgreSQL Sandbox
📋 System Requirements for the Sandbox Lab
a) Memory (RAM): 16 GB
b) CPU: 6 vCPUs
⚠️ Note:
The recommended configuration above is intended to support all demonstrations in this series, including large datasets, execution plan analysis, indexing, vacuum operations, and performance tuning exercises.
If your system has limited resources, you may allocate fewer CPU cores and less memory. Most examples in this series can still be followed successfully with a smaller configuration.
🛠️ 1.1 Install the Prerequisite Software
1 Install Oracle virtual box – Virtualbox
2 Install Vagrant – vagrant
3 Install putty – putty
📁 1.2 Create the Lab Directory
Open Windows powershell prompt : and create a directory

# create a directory for our vagrant config
mkdir D:\sandboxes\postgres\postgres-lab01# Change the directory to our labs
cd D:\sandboxes\postgres\postgres-lab01# switch to the directory
D:# check if you are in right directory
echo %cd%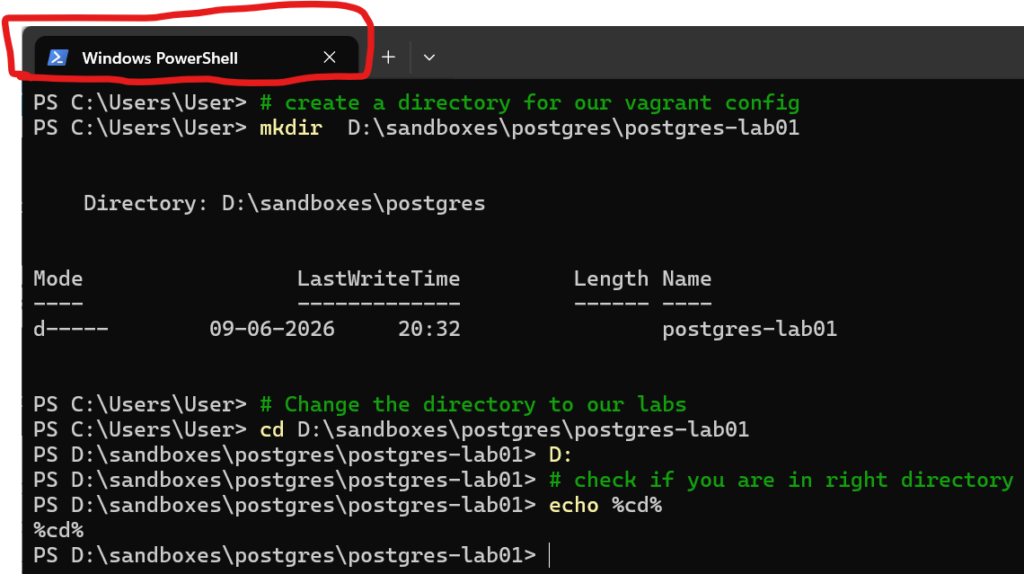
🚀 1.3 Bootstrap the Vagrant Environment
# Initiatlize the environment
vagrant initPS D:\sandboxes\postgres\postgres-lab01> # Initiatlize the environment PS D:\sandboxes\postgres\postgres-lab01> vagrant init A `Vagrantfile` has been placed in this directory. You are now ready to `vagrant up` your first virtual environment! Please read the comments in the Vagrantfile as well as documentation on `vagrantup.com` for more information on using Vagrant. PS D:\sandboxes\postgres\postgres-lab01>
🔄 1.4 Replace the Default Vagrantfile
- Go to the directory : D:\sandboxes\postgres\postgres-lab01 –
- open your favourite editor (notepad / notepad ++)
- copy the contents of the below code by expanding and replace it with the Vagrantfile
Note: Fine tune the parameters:'mem' => 3072, 'cpu' => 2– Incase you are running with limited configuration
expand_for_code (file to be edited in notepad / notepad++ )
# -*- mode: ruby -*-
# vi: set ft=ruby :

# --- Configuration Data ---
# Merged directly into the script for single-file portability
conf = {
  'shared' => {
    'box' => "oraclebase/oracle-9"
  },
  'nodes' => [
    { 'name' => 'postgres-lab01',    'ip' => '192.168.56.160', 'mem' => 16384, 'cpu' => 6 },
  ]
}

Vagrant.configure("2") do |config|
  # Loop through each node defined in the Hash above
  conf['nodes'].each do |node|
    config.vm.define node['name'] do |node_config|

      node_config.vm.box = conf['shared']['box']
      node_config.vm.hostname = node['name']
      node_config.vm.network "private_network", ip: node['ip']

      node_config.vm.provider "virtualbox" do |vb|
        vb.name   = node['name']
        vb.memory = node['mem']
        vb.cpus   = node['cpu']

        # Recommended for OEL9: Ensure high-resolution timers and IO APIC are enabled
        vb.customize ["modifyvm", :id, "--ioapic", "on"]
      end

      # Optional: Add a provisioner if you want to automate the pg_bindir fix
      # node_config.vm.provision "shell", inline: "echo 'Postgres nodes ready!'"
    end
  end
end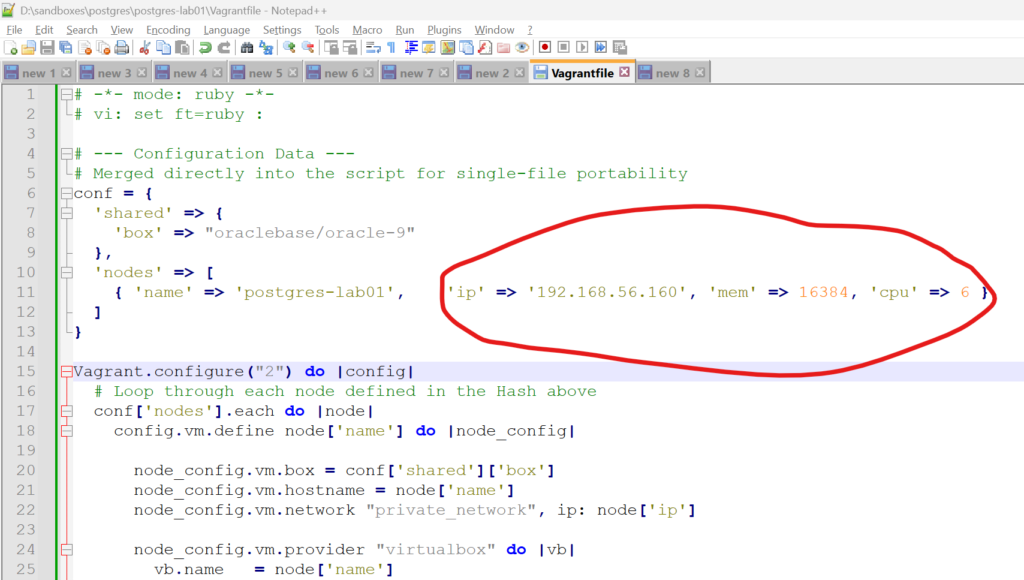
⚡ 1.5 Power Up the Sandbox
In the powershell prompt ,
in the path : D:\sandboxes\postgres\postgres-lab01 ,
Issue below command.
# Start the sandbox machine
vagrant up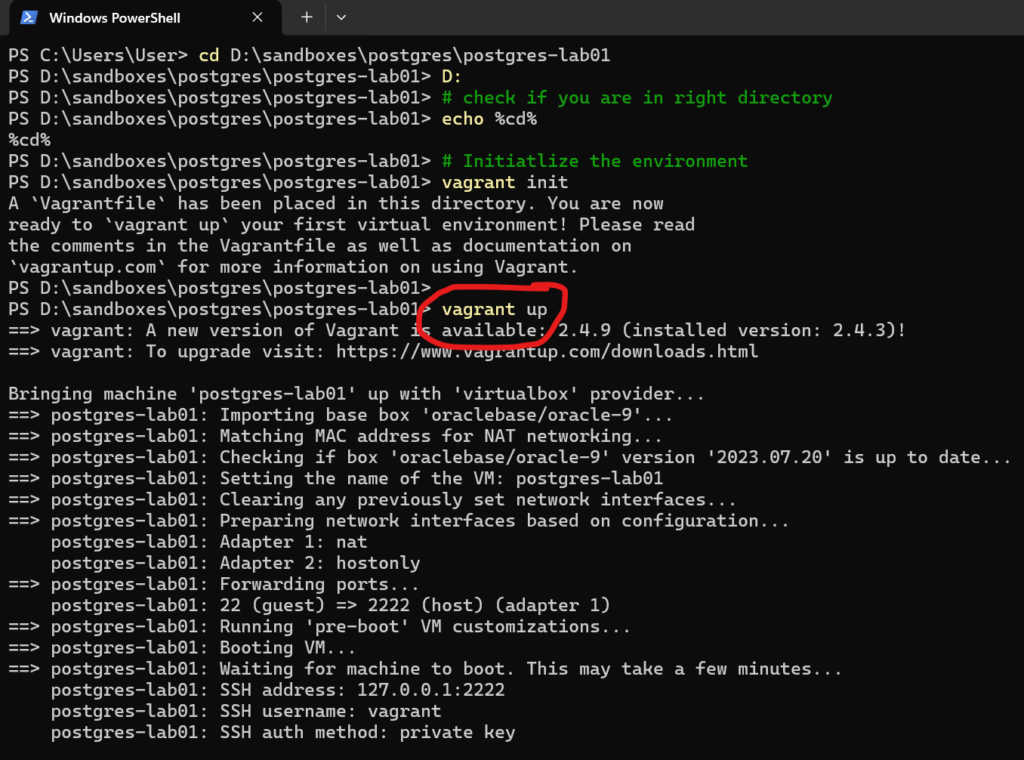
⏳ Estimated startup time: ~10 minutes
1.6 : 🖥️ Login to the Server
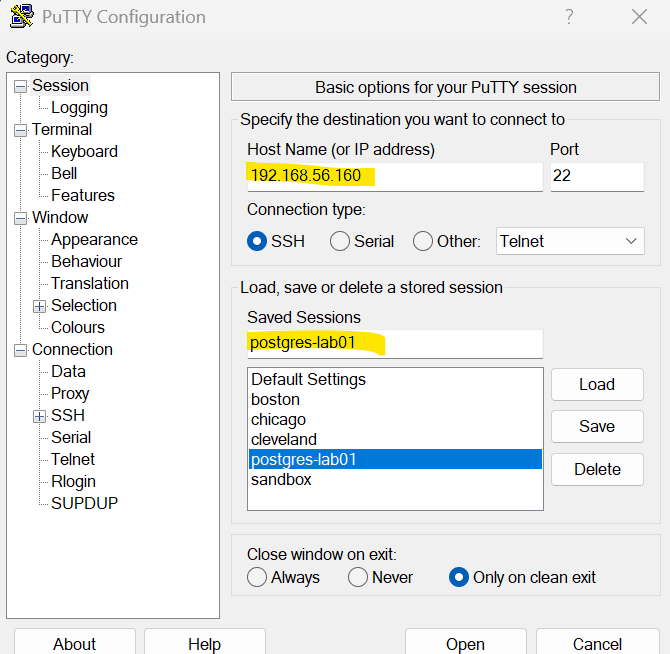
🚀 Launch PuTTY, connect to 192.168.56.160, and save the session as postgres-lab01 for future use.
- 👤 Username : vagrant
- 🔑 Password : vagrant
🐘 1.7 Install PostgreSQL and Create the Database
👤 Execute as the vagrant User
# Add postgresql RPM repository - approx time 05 mins for installation
sudo dnf install -y https://download.postgresql.org/pub/repos/yum/reporpms/EL-9-x86_64/pgdg-redhat-repo-latest.noarch.rpm# Disable the default PostgreSQL Application Stream module
sudo dnf -qy module disable postgresql# Install PostgreSQL 16 server and useful extras
sudo dnf install -y postgresql16-server postgresql16-contrib postgresql16# Force the SSH client to match the new libraries
sudo dnf reinstall openssh-clients openssh-server -y
sudo dnf update openssh-clients openssh-server -ywe will create a cluster database named as “postgres-lab01“
# Initialize the database cluster
sudo mkdir -p /var/lib/pgsql/postgres-lab01
sudo chown postgres:postgres /var/lib/pgsql/postgres-lab01
sudo -u postgres /usr/pgsql-16/bin/initdb -D /var/lib/pgsql/postgres-lab01we will switch to the system’s postgres user and access the database using the psql utility.
# switch to postgres user
sudo -i -u postgres# Start the Cluster onboarding
/usr/pgsql-16/bin/pg_ctl -D /var/lib/pgsql/postgres-lab01 -l logfile start1.8 Create modular config files
# check the config file name
psql --port=5432 --username=postgres -c "SHOW config_file;"# Update the config file to include directories
# 1. Copy the postgresql.conf
cp /var/lib/pgsql/postgres-lab01/postgresql.conf /var/lib/pgsql/postgres-lab01/postgresql.conf.bak_$(date +%Y%m%d)
# 2. Create the Configuration Directory
mkdir -p /var/lib/pgsql/postgres-lab01/conf.d
# 3. Append the include_dir Statement
echo "include_dir = '/var/lib/pgsql/postgres-lab01/conf.d'" >> /var/lib/pgsql/postgres-lab01/postgresql.conf
# 4. Verify the Change
tail -n 1 /var/lib/pgsql/postgres-lab01/postgresql.conf
# 5. Create the respective config files
touch /var/lib/pgsql/postgres-lab01/conf.d/00-extensions.conf
touch /var/lib/pgsql/postgres-lab01/conf.d/01-performance.conf
touch /var/lib/pgsql/postgres-lab01/conf.d/02-logging.conf
touch /var/lib/pgsql/postgres-lab01/conf.d/03-vacuum.conf
touch /var/lib/pgsql/postgres-lab01/conf.d/04-wal.confCongratulations:
You have completed a sandbox cluster named – postgres-lab01 running in port 5432.
🐘 Chapter 2 – Build the Performance Tuning Lab
🐘 Chapter 2 – Build the Performance Tuning Lab
📌 Goal
- 🏦 Create database creditcards
- 📂 Create schema consumer
- 🧱 Create core tables
- 👤 customers
- 💳 credit_cards
- 💸 transactions
- 💰 payments
- 🎲 Generate realistic sample data
- 📈 Load millions of rows
- ✅ Verify row counts
2.1 🏦 Create the Credit Cards Database
psql --port=5432 --username=postgres -c "
CREATE DATABASE creditcards;
"2.2 📂 Create the Consumer Schema
psql --port=5432 --username=postgres -d creditcards -c "
CREATE SCHEMA consumer;
"2.3 👤 Create Customers Table
psql --port=5432 --username=postgres -d creditcards -c "
CREATE TABLE consumer.customers
(
    customer_id        BIGSERIAL PRIMARY KEY,
    first_name         VARCHAR(50),
    last_name          VARCHAR(50),
    email              VARCHAR(100),
    phone_number       VARCHAR(20),
    city               VARCHAR(50),
    state              VARCHAR(50),
    created_date       TIMESTAMP DEFAULT CURRENT_TIMESTAMP
);
"2.4 💳 Create Credit Cards Table
psql --port=5432 --username=postgres -d creditcards -c "
CREATE TABLE consumer.credit_cards
(
    card_id            BIGSERIAL PRIMARY KEY,
    customer_id        BIGINT NOT NULL,
    card_number        VARCHAR(20),
    card_type          VARCHAR(20),
    credit_limit       NUMERIC(12,2),
    issue_date         DATE,
    expiry_date        DATE,
    status             VARCHAR(20),
    CONSTRAINT fk_cc_customer
    FOREIGN KEY (customer_id)
    REFERENCES consumer.customers(customer_id)
);
"2.5 💸 Create Transactions Table
psql --port=5432 --username=postgres -d creditcards -c "
CREATE TABLE consumer.transactions
(
    transaction_id     BIGSERIAL PRIMARY KEY,
    card_id            BIGINT NOT NULL,
    merchant_name      VARCHAR(100),
    transaction_amount NUMERIC(12,2),
    transaction_date   TIMESTAMP,
    transaction_type   VARCHAR(20),
    city               VARCHAR(50),
    status             VARCHAR(20),
    CONSTRAINT fk_txn_card
    FOREIGN KEY (card_id)
    REFERENCES consumer.credit_cards(card_id)
);
"2.6 💰 Create Payments Table
psql --port=5432 --username=postgres -d creditcards -c "
CREATE TABLE consumer.payments
(
    payment_id         BIGSERIAL PRIMARY KEY,
    customer_id        BIGINT NOT NULL,
    payment_amount     NUMERIC(12,2),
    payment_method     VARCHAR(20),
    payment_date       TIMESTAMP,
    CONSTRAINT fk_payment_customer
    FOREIGN KEY (customer_id)
    REFERENCES consumer.customers(customer_id)
);
"2.7 🔍 Verify the Objects
psql --port=5432 --username=postgres -d creditcards -c "
SELECT
    schemaname,
    tablename
FROM pg_tables
WHERE schemaname='consumer';
"2.8 👤 Generate Customer Data
psql --port=5432 --username=postgres -d creditcards -c "
INSERT INTO consumer.customers
(
    first_name,
    last_name,
    email,
    phone_number,
    city,
    state
)
SELECT
    'Customer_' || g,
    'Lastname_' || g,
    'customer' || g || '@example.com',
    '555-' || lpad(g::text,6,'0'),
    'City_' || (g % 100),
    'State_' || (g % 20)
FROM generate_series(1,1000000) g;
"2.9 💳 Generate Credit Card Data
psql --port=5432 --username=postgres -d creditcards -c "
INSERT INTO consumer.credit_cards
(
    customer_id,
    card_number,
    card_type,
    credit_limit,
    issue_date,
    expiry_date,
    status
)
SELECT
    customer_id,
    '4000' || lpad(customer_id::text,12,'0'),
    CASE
        WHEN customer_id % 3 = 0 THEN 'VISA'
        WHEN customer_id % 3 = 1 THEN 'MASTERCARD'
        ELSE 'AMEX'
    END,
    (random()*9000+1000)::numeric(12,2),
    CURRENT_DATE - ((random()*1000)::int),
    CURRENT_DATE + ((random()*1000)::int),
    'ACTIVE'
FROM consumer.customers;
"2.10 💸 Generate Transaction Data (10 Million Rows)
psql --port=5432 --username=postgres -d creditcards -c "
INSERT INTO consumer.transactions
(
    card_id,
    merchant_name,
    transaction_amount,
    transaction_date,
    transaction_type,
    city,
    status
)
SELECT
    floor(random()*1000000 + 1)::bigint,
    'Merchant_' || (g % 5000),
    (random()*5000)::numeric(12,2),
    CURRENT_TIMESTAMP - ((random()*365)::int || ' days')::interval,
    CASE
        WHEN g % 2 = 0 THEN 'PURCHASE'
        ELSE 'REFUND'
    END,
    'City_' || (g % 100),
    'COMPLETED'
FROM generate_series(1,10000000) g;
"2.11 💰 Generate Payment Data
psql --port=5432 --username=postgres -d creditcards -c "
INSERT INTO consumer.payments
(
    customer_id,
    payment_amount,
    payment_method,
    payment_date
)
SELECT
    floor(random() * 1000000 + 1)::bigint,
    (random()*3000)::numeric(12,2),
    CASE
        WHEN g % 3 = 0 THEN 'ACH'
        WHEN g % 3 = 1 THEN 'CARD'
        ELSE 'WIRE'
    END,
    CURRENT_TIMESTAMP - ((random()*365)::int || ' days')::interval
FROM generate_series(1,3000000) g;
"2.12 📊 Verify Row Counts
psql --port=5432 --username=postgres -d creditcards -c "
SELECT 'customers' table_name, count(*) FROM consumer.customers
UNION ALL
SELECT 'credit_cards', count(*) FROM consumer.credit_cards
UNION ALL
SELECT 'transactions', count(*) FROM consumer.transactions
UNION ALL
SELECT 'payments', count(*) FROM consumer.payments;
"table_name | count
--------------+----------
credit_cards | 1000000
customers | 1000000
payments | 3000000
transactions | 10000000
(4 rows)
2.13 📊 Verify Table size
 psql --port=5432 --username=postgres -d creditcards -c "
SELECT
    schemaname,
    relname AS table_name,
    pg_size_pretty(pg_relation_size(relid)) AS table_size,
    pg_size_pretty(pg_indexes_size(relid)) AS index_size,
    pg_size_pretty(pg_total_relation_size(relid)) AS total_size
FROM pg_catalog.pg_statio_user_tables
WHERE schemaname='consumer'
ORDER BY pg_total_relation_size(relid) DESC;
"
 schemaname |  table_name  | table_size | index_size | total_size
------------+--------------+------------+------------+------------
 consumer   | transactions | 1032 MB    | 214 MB     | 1247 MB
 consumer   | payments     | 195 MB     | 64 MB      | 260 MB
 consumer   | customers    | 128 MB     | 21 MB      | 150 MB
 consumer   | credit_cards | 91 MB      | 21 MB      | 112 MB
(4 rows)
Enable the logging
cat <<EOF > /var/lib/pgsql/postgres-lab01/conf.d/02-logging.conf
# ============================================================
# PostgreSQL Logging Configuration
# Purpose: Production-grade performance troubleshooting logs
# ============================================================


# ------------------------------------------------------------
# Log Storage and Destination
# ------------------------------------------------------------
logging_collector = on
log_destination = 'stderr'
log_directory = 'log'


# ------------------------------------------------------------
# Naming and Rotation
# Format: postgresql-YYYY-MM-DD_HHMMSS.log
# ------------------------------------------------------------
log_filename = 'postgresql-%Y-%m-%d_%H%M%S.log'
log_rotation_age = 1d
log_rotation_size = 1000MB
log_truncate_on_rotation = off


# ------------------------------------------------------------
# Log Content Identity
# Helps identify who ran what, from where, and through which app along with queryid
# ------------------------------------------------------------
log_line_prefix = '%m [%p] %q%u@%d [query_id=%Q] app=%a client=%h '

# log the queryid
compute_query_id = on

# ------------------------------------------------------------
# Slow Query Logging
# Logs queries running longer than 1 second
# ------------------------------------------------------------
log_min_duration_statement = 1000ms


# ------------------------------------------------------------
# Lock, Wait, and Deadlock Auditing
# Logs lock waits longer than deadlock_timeout
# ------------------------------------------------------------
log_lock_waits = on
deadlock_timeout = '1s'


# ------------------------------------------------------------
# Temporary File / Spill Logging
# Captures large sort/hash spills to disk
# Use 0 temporarily for deep troubleshooting
# ------------------------------------------------------------
log_temp_files = 64MB


# ------------------------------------------------------------
# Checkpoint Logging
# Useful for identifying checkpoint-related I/O spikes
# ------------------------------------------------------------
log_checkpoints = on


# ------------------------------------------------------------
# Autovacuum Logging
# Logs autovacuum actions taking longer than 1 second
# Use 0 temporarily for full autovacuum visibility
# ------------------------------------------------------------
log_autovacuum_min_duration = 1000ms


# ------------------------------------------------------------
# Error Statement Logging
# Logs SQL statement that caused an error
# ------------------------------------------------------------
log_min_error_statement = error


# ------------------------------------------------------------
# General Message Level
# Keeps normal server logs useful without being too noisy
# ------------------------------------------------------------
log_min_messages = warning


# ------------------------------------------------------------
# Connection Logging
# Keep these off by default in busy production systems.
# Turn on temporarily if investigating connection storms.
# ------------------------------------------------------------
log_connections = off
log_disconnections = off


# ------------------------------------------------------------
# Statement Logging
# Keep this off in production to avoid huge logs and sensitive data exposure.
# Prefer log_min_duration_statement instead.
# ------------------------------------------------------------
log_statement = 'none'
log_duration = off
EOF🔧 Chapter 3 – Essential Extensions for Performance Tuning
🔧 Chapter 3 – Essential Extensions for Performance Tuning
📌 Goal
Install and understand the key PostgreSQL extensions used in performance work:
- 🔍
pg_stat_statements– Track SQL performance - 📝
auto_explain– Log execution plans automatically - 💾
pg_buffercache– Inspect shared buffer cache - 📊
pgstattuple– Measure table/index bloat - 🧪
hypopg– Create hypothetical indexes - ⚡
pg_prewarm– Preload data into memory - 🧾 pg_profile + dblink + pg_cron Setup -Similar to Oracle AWR functionality
Why Extensions Matter
🗂️ 3.1 Configure the Extensions Configuration File
In our lab environment, we follow a modular configuration approach. Instead of modifying postgresql.conf directly, extension-related settings will be maintained in a dedicated file.
📄 Configuration File:
/var/lib/pgsql/postgres-lab01/conf.d/00-extensions.conf🧠 3.2 Why Do Some Extensions Require a Restart?
Extensions such as pg_stat_statements and auto_explain integrate directly with the PostgreSQL engine and must be loaded during server startup. Extensions that simply provide SQL functions can be installed using CREATE EXTENSION without restarting PostgreSQL.
🔍 3.3 pg_stat_statements
🎯 Why It Matters
This is one of the most useful tuning extensions. It shows which SQL statements are consuming the most time and resources.
⚙️ Configure It
# update the extensions.conf file -
cat >> /var/lib/pgsql/postgres-lab01/conf.d/00-extensions.conf <<EOF
# Shared libraries loaded during PostgreSQL startup
shared_preload_libraries = 'pg_stat_statements'
#
EOF# Put the pg_stat_statements in 01-performance.conf:
cat >> /var/lib/pgsql/postgres-lab01/conf.d/01-performance.conf <<EOF
# ------------------------------------------------------------
# pg_stat_statements
# Tracks query execution statistics across the database
# ------------------------------------------------------------
pg_stat_statements.max = 10000
pg_stat_statements.track = all
pg_stat_statements.track_planning = on
pg_stat_statements.save = on
#
EOF# Restart PostgreSQL after updating the preload setting.
/usr/pgsql-16/bin/pg_ctl restart -D /var/lib/pgsql/postgres-lab01# Create the extension:
psql -p 5432 -U postgres -d creditcards -c "
CREATE EXTENSION pg_stat_statements;
"🧪 Practical Example
Run this query a few times:
psql -p 5432 -U postgres -d creditcards -c "
SELECT *
FROM consumer.transactions
WHERE card_id = 100;
"# check the collected stats:
psql -p 5432 -U postgres -d creditcards -c "
SELECT
calls,
total_exec_time,
mean_exec_time,
query
FROM pg_stat_statements
ORDER BY total_exec_time DESC
LIMIT 10;
"[postgres@postgres-lab01 ~]$ psql -p 5432 -U postgres -d creditcards -c "
SELECT
calls,
total_exec_time,
mean_exec_time,
query
FROM pg_stat_statements
ORDER BY total_exec_time DESC
LIMIT 10;
"
calls | total_exec_time | mean_exec_time | query
-------+--------------------+--------------------+----------------------------------------------------------------------------
3 | 3569.50865 | 1189.8362166666666 | SELECT * +
| | | FROM consumer.transactions +
| | | WHERE card_id = $1
1 | 87.175479 | 87.175479 | CREATE EXTENSION pg_stat_statements
4 | 19.770034000000003 | 4.9425085 | -- Register a view on the function for ease of use. +
| | | CREATE VIEW pg_stat_statements AS +
📝 3.4 auto_explain
🎯 Why It Matters
Sometimes a slow query happens once, and by the time you look at it, the plan is gone. auto_explain captures execution plans automatically.
# update the extensions.conf file
sed -i "s/shared_preload_libraries = 'pg_stat_statements'/shared_preload_libraries = 'pg_stat_statements,auto_explain'/" \
/var/lib/pgsql/postgres-lab01/conf.d/00-extensions.conf# verify the update
cat /var/lib/pgsql/postgres-lab01/conf.d/00-extensions.conf# update the 01-performance.conf file
cat >> /var/lib/pgsql/postgres-lab01/conf.d/01-performance.conf <<EOF
# ------------------------------------------------------------
# auto_explain
# Logs execution plans for slow queries
# Good for lab and targeted troubleshooting
# Be careful with log_analyze in very busy production
# ------------------------------------------------------------
auto_explain.log_min_duration = '500ms'
auto_explain.log_analyze = on
auto_explain.log_buffers = on
auto_explain.log_timing = on
auto_explain.log_nested_statements = on
auto_explain.sample_rate = 1.0
#
EOF🔄 Restart PostgreSQL after updating the auto explain setting.
# Restart PostgreSQL after updating the preload setting.
/usr/pgsql-16/bin/pg_ctl restart -D /var/lib/pgsql/postgres-lab01📌 Unlike most extensions in this chapter,
auto_explaindoes not require aCREATE EXTENSIONcommand. It is activated by loading the library throughshared_preload_librariesand configuring its logging parameters.
🧪 Practical Example
# execute an select statement on the transactions table
psql -p 5432 -U postgres -d creditcards -c "
SELECT *
FROM consumer.transactions
ORDER BY transaction_amount DESC
LIMIT 40;
"# review the latest PostgreSQL log file
tail -n 100 $(ls -1t /var/lib/pgsql/postgres-lab01/log/*.log | head -1)2026-06-11 21:03:38.904 UTC [8957] LOG: duration: 1487.198 ms plan:
Query Text:
SELECT *
FROM consumer.transactions
ORDER BY transaction_amount DESC
LIMIT 40;
Limit (cost=306509.43..306514.09 rows=40 width=67) (actual time=1471.536..1485.967 rows=40 loops=1)
Buffers: shared hit=360 read=131855
-> Gather Merge (cost=306509.43..1278759.71 rows=8332992 width=67) (actual time=1471.533..1485.958 rows=40 loops=1)
Workers Planned: 2
Workers Launched: 2
Buffers: shared hit=360 read=131855
-> Sort (cost=305509.40..315925.64 rows=4166496 width=67) (actual time=1462.998..1463.003 rows=31 loops=3)
Sort Key: transaction_amount DESC
Sort Method: top-N heapsort Memory: 33kB
Buffers: shared hit=360 read=131855
Worker 0: Sort Method: top-N heapsort Memory: 34kB
Worker 1: Sort Method: top-N heapsort Memory: 34kB
-> Parallel Seq Scan on transactions (cost=0.00..173807.96 rows=4166496 width=67) (actual time=0.130..525.802 rows=3333333 loops=3)
Buffers: shared hit=288 read=131855
[postgres@postgres-lab01 ~]$
Lab Takeaway
📌 With
auto_explain.log_min_duration = 500ms, PostgreSQL automatically captures execution plans only for queries whose execution time exceeds 500 milliseconds. This helps identify expensive queries without logging every statement executed by the database.
💾 3.5 pg_buffercache
🎯 Why It Matters
Shows what is currently occupying PostgreSQL shared memory.
# Create the extension
psql -p 5432 -U postgres -d creditcards -c "
CREATE EXTENSION pg_buffercache;
"🧪 Practical Example
# Identify the hottest tables in memory.
psql -p 5432 -U postgres -d creditcards -c "
SELECT
    c.relname,
    count(*) AS buffers
FROM pg_buffercache b
JOIN pg_class c
ON b.relfilenode = pg_relation_filenode(c.oid)
GROUP BY c.relname
ORDER BY buffers DESC
LIMIT 10;
"[postgres@postgres-lab01 ~]$ # Create the extension
psql -p 5432 -U postgres -d creditcards -c "
CREATE EXTENSION pg_buffercache;
"
CREATE EXTENSION
[postgres@postgres-lab01 ~]$
# Identify the hottest tables in memory.
psql -p 5432 -U postgres -d creditcards -c "
SELECT
    c.relname,
    count(*) AS buffers
FROM pg_buffercache b
JOIN pg_class c
ON b.relfilenode = pg_relation_filenode(c.oid)
GROUP BY c.relname
ORDER BY buffers DESC
LIMIT 10;
"
relname | buffers
---------------------------------+---------
transactions | 384
pg_attribute | 90
pg_class | 45
pg_attribute_relid_attnum_index | 22
📌 This helps you see which tables are hot in memory.
📊 3.6 pgstattuple
🎯 Why It Matters
Updates and deletes create dead space.pgstattuple helps answer:
❓ How much table bloat exists?
# create the extension:
psql -p 5432 -U postgres -d creditcards -c "
CREATE EXTENSION pgstattuple;
"# Check for bloating:
psql -p 5432 -U postgres -d creditcards -x -c "
SELECT *
FROM pgstattuple('consumer.transactions');
"[postgres@postgres-lab01 ~]$ # create the extension:
psql -p 5432 -U postgres -d creditcards -c "
CREATE EXTENSION pgstattuple;
"
CREATE EXTENSION
[postgres@postgres-lab01 ~]$ # Check for bloating:
psql -p 5432 -U postgres -d creditcards -x -c "
SELECT *
FROM pgstattuple('consumer.transactions');
"
-[ RECORD 1 ]------+-----------
table_len | 1082515456
tuple_count | 10000000
tuple_len | 978998376
tuple_percent | 90.44
dead_tuple_count | 0
dead_tuple_len | 0
dead_tuple_percent | 0
free_space | 3173692
free_percent | 0.29
[postgres@postgres-lab01 ~]$
📌Focus on values like dead_tuple_percent and free_percent.
🧪 3.7 hypopg
🎯 Why It Matters
This extension lets you test a hypothetical index without actually creating it.
Switch back to "vagrant" user and run the below commands
# Install the rpm as vagrant / root user
sudo dnf install -y hypopg_16# Switch to postgres account
sudo su - postgres# create the extension
psql -p 5432 -U postgres -d creditcards -c "
CREATE EXTENSION hypopg;
"Capture the current execution plan, create a hypothetical index, and capture the execution plan again.
psql -p 5432 -U postgres -d creditcards <<'SQL'
EXPLAIN (COSTS OFF)
SELECT transaction_id, card_id, transaction_date
FROM consumer.transactions
WHERE status = 'COMPLETED'
ORDER BY transaction_date DESC
LIMIT 20;

SELECT *
FROM hypopg_create_index(
'CREATE INDEX ON consumer.transactions(status, transaction_date DESC)'
);

EXPLAIN (COSTS OFF)
SELECT transaction_id, card_id, transaction_date
FROM consumer.transactions
WHERE status = 'COMPLETED'
ORDER BY transaction_date DESC
LIMIT 20;
SQLQUERY PLAN
------------------------------------------------------------------
Limit
-> Gather Merge
Workers Planned: 2
-> Sort
Sort Key: transaction_date DESC
-> Parallel Seq Scan on transactions
Filter: ((status)::text = 'COMPLETED'::text)
(7 rows)
indexrelid | indexname
------------+------------------------------------------------------------
13587 | <13587>btree_consumer_transactions_status_transaction_date
(1 row)
QUERY PLAN
-----------------------------------------------------------------------------------------------------
Limit
-> Index Scan using "<13587>btree_consumer_transactions_status_transaction_date" on transactions
Index Cond: ((status)::text = 'COMPLETED'::text)
(3 rows)
🎯 HypoPG Benefit
The hypothetical index demonstrated that PostgreSQL would choose an Index Scan instead of a Sequential Scan. This allows DBAs to evaluate the potential benefit of an index before creating it in the database.
⚡ 3.9 pg_prewarm
🎯 Why It Matters
After a restart, cache is cold. pg_prewarm helps load frequently used data into memory ahead of time.
# Create the extension:
psql -p 5432 -U postgres -d creditcards -c "
CREATE EXTENSION pg_prewarm;
"# Preload the table into PostgreSQL shared buffers:
psql -p 5432 -U postgres -d creditcards -c "
SELECT pg_prewarm('consumer.customers');
"[postgres@postgres-lab01 ~]$ # pre warm the table:
psql -p 5432 -U postgres -d creditcards -c "
SELECT pg_prewarm('consumer.customers');
"
pg_prewarm
------------
16388
(1 row)
📌 Prewarming is useful for small, frequently used tables and indexes that applications access immediately after startup, helping avoid cold-cache performance delays.
3.10 🧾 pg_profile + dblink + pg_cron Setup
- 🧾 pg_profile → Generate AWR-like historical performance reports
- 🔗 dblink → Required by pg_profile to connect and collect statistics
- ⏰ pg_cron → Schedule pg_profile snapshots automatically
Steps
# Install the rpm as vagrant / root user
sudo dnf install -y pg_cron_16# Move to temp directory
cd /tmp# Download pg_profile package
wget https://github.com/zubkov-andrei/pg_profile/releases/download/4.11/pg_profile--4.11.tar.gz# Extract pg_profile into PostgreSQL 16 extension directory
sudo tar xzf pg_profile--4.11.tar.gz --directory /usr/pgsql-16/share/extension# update the extensions.conf file
sed -i "s/shared_preload_libraries = 'pg_stat_statements,auto_explain'/shared_preload_libraries = 'pg_stat_statements,auto_explain,pg_cron'/" /var/lib/pgsql/postgres-lab01/conf.d/00-extensions.conf# update the 01-performance.conf file
cat >> /var/lib/pgsql/postgres-lab01/conf.d/01-performance.conf <<EOF
# ------------------------------------------------------------
# Captures SQL execution statistics
# Required for query-level performance analysis
# Useful for finding expensive SQL statements
# ------------------------------------------------------------
track_activities = on
track_counts = on
track_io_timing = on
track_wal_io_timing = on
# ------------------------------------------------------------
# pg_cron
# Runs scheduled jobs inside PostgreSQL
# Used here to schedule pg_profile snapshots
# cron.database_name tells pg_cron where its metadata lives
# ------------------------------------------------------------
cron.database_name = 'postgres'
cron.timezone = 'Europe/Amsterdam'
EOF# Restart PostgreSQL after updating the preload setting.
/usr/pgsql-16/bin/pg_ctl restart -D /var/lib/pgsql/postgres-lab01# Create required extensions
psql -p 5432 -U postgres -d postgres -c "
CREATE EXTENSION IF NOT EXISTS dblink;
CREATE EXTENSION IF NOT EXISTS pg_stat_statements;
CREATE EXTENSION IF NOT EXISTS pg_cron;
"# Create pg_profile extension in profile schema
psql -p 5432 -U postgres -d postgres -c "
CREATE SCHEMA IF NOT EXISTS profile;
CREATE EXTENSION IF NOT EXISTS pg_profile SCHEMA profile;
"# Verify installed extensions
psql -p 5432 -U postgres -d postgres -c "
SELECT extname, extversion
FROM pg_extension
WHERE extname IN ('dblink', 'pg_stat_statements', 'pg_cron', 'pg_profile')
ORDER BY extname;
"# Update the Connection String to creditcards
psql -d postgres -c "SELECT profile.set_server_connstr('creditcards', 'dbname=creditcards port=5432');"# Take first pg_profile snapshot
psql -p 5432 -U postgres -d postgres -c "
SELECT profile.take_sample();
"# Run workload in creditcards database
psql -p 5432 -U postgres -d creditcards -c "
SELECT state, COUNT(*)
FROM consumer.customers
GROUP BY state
ORDER BY COUNT(*) DESC;
"# Take second pg_profile snapshot
psql -p 5432 -U postgres -d postgres -c "
SELECT profile.take_sample();
"Intentionally commented out all the below lines. Below is an example of how to set the cron job for pg_profile.
# Schedule pg_profile snapshot every 30 minutes
#psql -p 5432 -U postgres -d postgres -c "
#SELECT cron.schedule(
#  'pg_profile_snapshot_every_30_min',
#  '*/30 * * * *',
#  'SELECT profile.take_sample();'
#);
#"# Check scheduled pg_cron jobs
psql -p 5432 -U postgres -d postgres -c "
SELECT jobid, jobname, schedule, command, active
FROM cron.job
ORDER BY jobid;
"🏁 Chapter Summary
In this chapter, we configured PostgreSQL extensions using a modular configuration approach and explored the tools commonly used during performance investigations.
We learned how to:
- ✅ Capture expensive SQL statements using
pg_stat_statements - ✅ Automatically log execution plans using
auto_explain - ✅ Inspect buffer cache usage with
pg_buffercache - ✅ Measure table bloat using
pgstattuple - ✅ Evaluate indexing strategies using
hypopg - ✅ Warm the PostgreSQL cache using
pg_prewarm - 🧾 pg_profile gives us AWR-like historical performance reports.
- 🔗 dblink is required by pg_profile to collect database statistics.
- ⏰ pg_cron helps us schedule regular pg_profile snapshots.
📊 Chapter 4 – Reading Execution Plans
📊 Chapter 4 – Reading Execution Plans
📌 Goal
Learn how PostgreSQL executes queries and how to interpret execution plans using:
- 🔎 EXPLAIN
- 🔎 EXPLAIN ANALYZE
- 🔎 EXPLAIN (ANALYZE, BUFFERS)
Understand common plan nodes:
- 📖 Seq Scan
- 📖 Index Scan
- 📖 Bitmap Scan
- 📖 Sort
- 📖 Aggregate
🎯 4.1 Why Execution Plans Matter
Before tuning a query, we must understand how PostgreSQL executes it.
An execution plan answers questions such as:
- Which tables are being scanned?
- Is PostgreSQL using an index?
- Is data being sorted?
- How much work is being performed?
📌 Performance tuning starts with reading execution plans.
🔎 4.2 Understanding EXPLAIN
What is EXPLAIN?
EXPLAIN shows the execution plan PostgreSQL intends to use.
# Execute the explain plan
psql -p 5432 -U postgres -d creditcards -c "
EXPLAIN
SELECT *
FROM consumer.transactions
WHERE card_id = 100;
"QUERY PLAN
---------------------------------------------------------------------------------
Gather (cost=1000.00..185225.30 rows=11 width=67)
Workers Planned: 2
-> Parallel Seq Scan on transactions (cost=0.00..184224.20 rows=5 width=67)
Filter: (card_id = 100)
(4 rows)
Look closely at the query plan. To fetch just 11 rows, PostgreSQL is forced to do an immense amount of heavy lifting:
- A massive cost of 185,225 units is incurred just to find those 11 matching records.
- 2 Parallel Workers are launched to scan the entire table simultaneously because there is no index to guide them.
🔎 4.3 Understanding EXPLAIN ANALYZE
What is EXPLAIN ANALYZE?
Unlike EXPLAIN, this actually executes the query.
# Execute the explain and analyze plan
psql -p 5432 -U postgres -d creditcards -c "
EXPLAIN ANALYZE
SELECT *
FROM consumer.transactions
WHERE card_id = 100;
"QUERY PLAN
Gather (cost=1000.00..185225.30 rows=11 width=67) (actual time=169.761..929.702 rows=11 loops=1)
Workers Planned: 2
Workers Launched: 2
-> Parallel Seq Scan on transactions (cost=0.00..184224.20 rows=5 width=67) (actual time=329.132..913.810 rows=4 loops=3)
Filter: (card_id = 100)
Rows Removed by Filter: 3333330
Planning Time: 0.988 ms
Execution Time: 930.582 ms
(8 rows)
The takeaway: Doing a full table scan and reading over 3 million rows to find 11 items is a massive waste of CPU. This confirms we absolutely need to add an index on card_id.
📌 EXPLAIN ANALYZE shows what actually happened where as in EXPLAIN query is not executed.
| EXPLAIN | EXPLAIN ANALYZE |
|---|---|
| Estimated rows | Actual rows |
| Estimated cost | Actual runtime |
| Query not executed | Query executed |
💾 4.4 Understanding BUFFERS
Why Buffers Matter
Performance problems often come from excessive disk I/O.
# Execute the explain with analyze and buffers
psql -p 5432 -U postgres -d creditcards -c "
EXPLAIN (ANALYZE, BUFFERS)
SELECT *
FROM consumer.transactions
WHERE card_id = 100;
"QUERY PLAN
Gather (cost=1000.00..185225.30 rows=11 width=67) (actual time=80.468..873.164 rows=11 loops=1)
Workers Planned: 2
Workers Launched: 2
Buffers: shared hit=96 read=132047
-> Parallel Seq Scan on transactions (cost=0.00..184224.20 rows=5 width=67) (actual time=132.177..857.839 rows=4 loops=3)
Filter: (card_id = 100)
Rows Removed by Filter: 3333330
Buffers: shared hit=96 read=132047
Planning:
Buffers: shared hit=78
Planning Time: 0.682 ms
Execution Time: 874.136 ms
(12 rows)
What the numbers mean for our query:
shared hit=96: Postgres found 96 pages of data already cached in RAM. It read these instantly.read=132047: Postgres had to go to the slow disk to pull 132,047 pages. Because it’s doing a full table scan, it has to load the entire table from the disk into memory just to check forcard_id = 100.
| Metric | Meaning |
|---|---|
| shared hit | Found in memory |
| shared read | Read from disk |
📌 More hits and fewer reads generally indicate better performance.
📖 4.5 Seq Scan
What is a Seq Scan?
PostgreSQL reads every row in the table.
# execute the explain plan
psql -p 5432 -U postgres -d creditcards -c "
EXPLAIN
SELECT *
FROM consumer.transactions
WHERE card_id = 100;
"-> Parallel Seq Scan on transactions (cost=0.00..184224.20 rows=5 width=67)
📌 Equivalent to a full table scan.
When is it good?
- Small tables
- Large result sets
When is it bad?
- Highly selective queries
- Large tables
📖 4.6 Index Scan
What is an Index Scan?
PostgreSQL uses an index to locate rows.
# Create demo index:
psql -p 5432 -U postgres -d creditcards -c "
CREATE INDEX idx_transactions_card_id
ON consumer.transactions(card_id);
"# execute the analyze plan
psql -p 5432 -U postgres -d creditcards -c "
EXPLAIN
SELECT *
FROM consumer.transactions
WHERE card_id = 100;
"QUERY PLAN
Index Scan using idx_transactions_card_id on transactions (cost=0.43..48.63 rows=11 width=67)
Index Cond: (card_id = 100)
(2 rows)
📌 Reads only matching rows.
After creating the index, PostgreSQL immediately switched from a heavy full table scan to a lightning-fast Index Scan, which dropped the estimated query cost from 185,225 down to just 48. Instead of reading millions of unrelated records, the database now uses the index condition to pinpoint and grab the exact 11 rows we need instantly.
📖 4.7 Bitmap Scan
🎯 What is a Bitmap Scan?
A Bitmap Scan is an access strategy PostgreSQL uses when many rows match an indexed condition.
Instead of repeatedly jumping between the index and table, PostgreSQL:
- Uses the index to identify matching rows
- Builds a bitmap of row locations
- Reads the required table pages efficiently
📌 Bitmap Scans are commonly used when an Index Scan would return a large number of rows.
# Capture the current execution plan before creating the index:
psql -p 5432 -U postgres -d creditcards -c "
EXPLAIN (COSTS OFF)
SELECT *
FROM consumer.transactions
WHERE merchant_name = 'Merchant_1';
"🔍 Check Data Distribution
psql -p 5432 -U postgres -d creditcards -c "
SELECT
    status,
    count(*)
FROM consumer.transactions
GROUP BY status;
"# create the index:
psql -p 5432 -U postgres -d creditcards -c "
CREATE INDEX idx_transactions_merchant
ON consumer.transactions(merchant_name);
"# Capture the current execution plan after creating the index:
psql -p 5432 -U postgres -d creditcards -c "
EXPLAIN (COSTS OFF)
SELECT *
FROM consumer.transactions
WHERE merchant_name = 'Merchant_1';
" QUERY PLAN
------------------------------------------------------------------
Bitmap Heap Scan on transactions
Recheck Cond: ((merchant_name)::text = 'Merchant_1'::text)
-> Bitmap Index Scan on idx_transactions_merchant
Index Cond: ((merchant_name)::text = 'Merchant_1'::text)
(4 rows)
📌 PostgreSQL uses the same B-tree index, but because many rows match merchant_name = 'Merchant_1', it chooses a Bitmap Scan strategy instead of a regular Index Scan. This allows PostgreSQL to collect all matching row locations first and then read the required table pages more efficiently.
Unlike a normal index scan that effortlessly zips straight to the exact row you need, a bitmap scan forces Postgres to pause and construct a massive search map directly inside the server’s RAM (work_mem).
📖 4.8 Sort
🎯 What is a Sort?
A Sort operation occurs when PostgreSQL needs to return rows in a specific order, typically when an ORDER BY clause is used.
# Check how PostgreSQL sorts the result set:
psql -p 5432 -U postgres -d creditcards -c "
EXPLAIN (COSTS OFF)
SELECT transaction_id,
       merchant_name,
       transaction_amount
FROM consumer.transactions
ORDER BY transaction_amount DESC
LIMIT 20;
"-----------------------------------------------------
Limit
-> Gather Merge
Workers Planned: 2
-> Sort
Sort Key: transaction_amount DESC
-> Parallel Seq Scan on transactions
(6 rows)
🎯 What Did We Learn?
📌 PostgreSQL performs a Sort operation whenever rows must be returned in a specific order. Large sorts may require additional memory and can become a performance bottleneck.
📖 4.9 Aggregate
🎯 What is an Aggregate?
An Aggregate operation combines multiple rows into a single result using functions such as:
- COUNT()
- SUM()
- AVG()
- MIN()
- MAX()
# Check how PostgreSQL performs aggregation:
psql -p 5432 -U postgres -d creditcards -c "
EXPLAIN (COSTS OFF)
SELECT count(*)
FROM consumer.transactions;
"--------------------------------------------------------------------------------------------
Finalize Aggregate
-> Gather
Workers Planned: 2
-> Partial Aggregate
-> Parallel Index Only Scan using idx_transactions_merchant on transactions
(5 rows)
🎯 What Did We Learn?
📌 PostgreSQL uses Aggregate operations to calculate summary values such as
COUNT(),SUM(), andAVG(). For large tables, PostgreSQL may use parallel processing to split the work across multiple workers and combine the results efficiently.
📖 4.10 Sort and Aggregate Together
🎯 Why Is This Important?
Real-world queries often contain multiple plan nodes working together.
The following query performs:
- Aggregation using
COUNT(*) - Sorting using
ORDER BY
# Check how PostgreSQL combines Aggregate and Sort operations:
psql -p 5432 -U postgres -d creditcards -c "
EXPLAIN (COSTS OFF)
SELECT
    merchant_name,
    count(*)
FROM consumer.transactions
GROUP BY merchant_name
ORDER BY count(*) DESC
LIMIT 10;
"QUERY PLAN
Limit
-> Sort
Sort Key: (count(*)) DESC
-> Finalize GroupAggregate
Group Key: merchant_name
-> Gather Merge
Workers Planned: 2
-> Partial GroupAggregate
Group Key: merchant_name
-> Parallel Index Only Scan using idx_transactions_merchant on transactions
(10 rows)
🎯 What Did We Learn?
📌 Execution plans are made up of multiple plan nodes working together. In this example, PostgreSQL used an Index Only Scan to read data, performed an Aggregate operation to calculate counts per merchant, and then sorted the results before returning the top 10 merchants.
🧪 4.11 Lab Exercise
# Analyze a complete execution plan:
psql -p 5432 -U postgres -d creditcards -c "
EXPLAIN (ANALYZE, BUFFERS)
SELECT
    merchant_name,
    count(*)
FROM consumer.transactions
GROUP BY merchant_name
ORDER BY count(*) DESC
LIMIT 10;
"Limit (cost=150701.32..150701.35 rows=10 width=21) (actual time=2806.104..2812.678 rows=10 loops=1)
Buffers: shared hit=31933 read=8891
-> Sort (cost=150701.32..150713.83 rows=5002 width=21) (actual time=2806.101..2812.672 rows=10 loops=1)
Sort Key: (count(*)) DESC
Sort Method: top-N heapsort Memory: 25kB
Buffers: shared hit=31933 read=8891
-> Finalize GroupAggregate (cost=1000.46..150593.23 rows=5002 width=21) (actual time=261.674..2808.781 rows=5000 loops=1)
Group Key: merchant_name
Buffers: shared hit=31930 read=8891
-> Gather Merge (cost=1000.46..150493.19 rows=10004 width=21) (actual time=261.049..2799.936 rows=9769 loops=1)
Workers Planned: 2
Workers Launched: 2
Buffers: shared hit=31930 read=8891
-> Partial GroupAggregate (cost=0.43..148338.46 rows=5002 width=21) (actual time=1.019..1864.360 rows=3256 loops=3)
Group Key: merchant_name
Buffers: shared hit=31930 read=8891
-> Parallel Index Only Scan using idx_transactions_merchant on transactions (cost=0.43..127455.10 rows=4166667 width=13) (actual
time=0.180..905.835 rows=3333333 loops=3)
Heap Fetches: 0
Buffers: shared hit=31930 read=8891
Planning:
Buffers: shared hit=112
Planning Time: 1.184 ms
Execution Time: 2813.582 ms
(23 rows)
🔍 How to Analyze an Execution Plan
📌 A useful approach is to read the execution plan from bottom to top, since PostgreSQL executes the lower operations first and then passes the results upward.
| Step | Plan Node | Startup Cost → Total Cost | Startup Time → Completion Time | Observation |
|---|---|---|---|---|
| 1 | Parallel Index Only Scan | 0.43 → 127455.10 | 0.180 ms → 905.835 ms | PostgreSQL reads data from the index without accessing the table. |
| 2 | Partial GroupAggregate | Included in parent node | 1.019 ms → 1864.360 ms | Each worker calculates partial counts independently. |
| 3 | Gather Merge | 1000.46 → 150493.19 | 261.049 ms → 2799.936 ms | PostgreSQL merges results from all parallel workers. |
| 4 | Finalize GroupAggregate | 1000.46 → 150593.23 | 261.674 ms → 2808.781 ms | Partial aggregates are combined into final counts. |
| 5 | Sort | 150701.32 → 150713.83 | 2806.101 ms → 2812.672 ms | Results are sorted by transaction count. |
| 6 | Limit | 150701.32 → 150701.35 | 2806.104 ms → 2812.678 ms | Only the top 10 rows are returned. |
📊 Buffer Statistics
| Metric | Value | Meaning |
|---|---|---|
| Shared Hit | 31,933 | Data found in memory |
| Shared Read | 8,891 | Data read from disk |
| Planning Buffers | 112 | Buffers used during plan generation |
📌 Execution plans should be read from bottom to top. By examining the scan operation, aggregation, sorting, buffer activity, costs, and execution times, we can understand how PostgreSQL executes a query and identify potential performance bottlenecks.
📈 Chapter 5 – Join Strategies Deep Dive
📈 Chapter 5 – Join Strategies Deep Dive
🎯 Lab Goal
- 🔗 Understand Nested Loop Join
- 🔗 Understand Hash Join
- 🔗 Understand Merge Join
- 🧪 Force each join method
- ⏱️ Compare execution times
🧩 Step 1 – Check the table sizes
#Check the size of the join tables:
psql -p 5432 -U postgres -d creditcards -c "
SELECT
    schemaname,
    tablename,
    pg_size_pretty(pg_total_relation_size(schemaname||'.'||tablename)) AS total_size
FROM pg_tables
WHERE schemaname = 'consumer'
  AND tablename IN ('customers', 'transactions','credit_cards');
"schemaname | tablename | total_size
------------+--------------+------------
consumer | credit_cards | 112 MB
consumer | customers | 150 MB
consumer | transactions | 1405 MB
(3 rows)
Step 2 – Refresh planner statistics
🧠 This helps PostgreSQL choose realistic join plans.
# Refresh statistics for both tables:
psql -p 5432 -U postgres -d creditcards -c "
ANALYZE consumer.customers;
ANALYZE consumer.credit_cards;
ANALYZE consumer.transactions;
"🧪 Step 3 – Observe PostgreSQL’s default join strategy
🔍 This is the same query you will use for all three join methods.
📌 Keep the query identical so the comparison is fair.
# Run the baseline join query with the default planner choice:
psql -p 5432 -U postgres -d creditcards -c "
EXPLAIN (ANALYZE, BUFFERS)
SELECT
    c.customer_id,
    c.first_name,
    c.last_name,
    COUNT(t.transaction_id) AS transaction_count
FROM consumer.customers c
JOIN consumer.credit_cards cc
    ON c.customer_id = cc.customer_id
JOIN consumer.transactions t
    ON cc.card_id = t.card_id
GROUP BY
    c.customer_id,
    c.first_name,
    c.last_name
ORDER BY transaction_count DESC
LIMIT 10;
"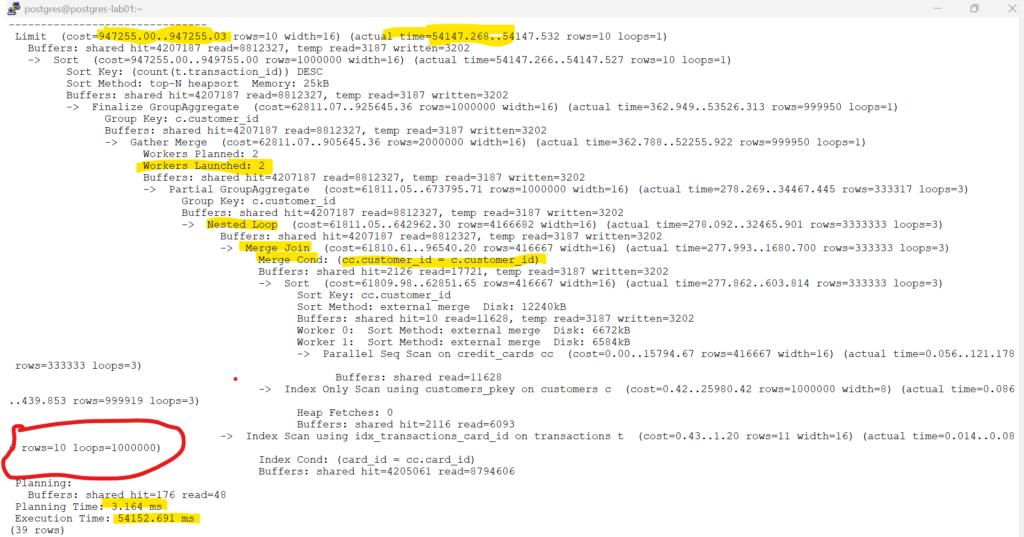
🧠 Key Takeaways
- 🔗 PostgreSQL chose a combination of Merge Join and Nested Loop Join to process the query.
- ⚙️ The planner used parallel execution (2 workers) to speed up processing.
- 🔄 The Nested Loop Join resulted in 1 million index lookups against the
transactionstable. - 📖 More than 8.8 million pages were read during execution, indicating significant I/O activity.
- ⏱️ The query completed in approximately 54 seconds, making it a good candidate for join strategy analysis.
🎓 What to Remember
When analyzing execution plans, focus on the operators consuming the most work. In this plan, the Nested Loop Join drove one million index lookups against the
transactionstable, making it the most expensive part of the execution.
🔗 Step 4 – Force a Nested Loop Join
🔍 In this step, we will force PostgreSQL to use a Nested Loop Join and compare its behavior with the default plan observed earlier.
📚 Understanding Nested Loop Join
A Nested Loop Join works by taking each row from one table and finding matching rows from another table.
🧪 Force PostgreSQL to Use a Nested Loop Join
To focus on Nested Loop behavior, disable Hash Join and Merge Join.
# Force PostgreSQL to use Nested Loop Join:
psql -p 5432 -U postgres -d creditcards -c "
SET enable_hashjoin = off;
SET enable_mergejoin = off;
SET enable_nestloop = on;

EXPLAIN (ANALYZE, BUFFERS)
SELECT
    c.customer_id,
    c.first_name,
    c.last_name,
    COUNT(t.transaction_id) AS transaction_count
FROM consumer.customers c
JOIN consumer.credit_cards cc
    ON c.customer_id = cc.customer_id
JOIN consumer.transactions t
    ON cc.card_id = t.card_id
GROUP BY
    c.customer_id,
    c.first_name,
    c.last_name
ORDER BY transaction_count DESC
LIMIT 10;
"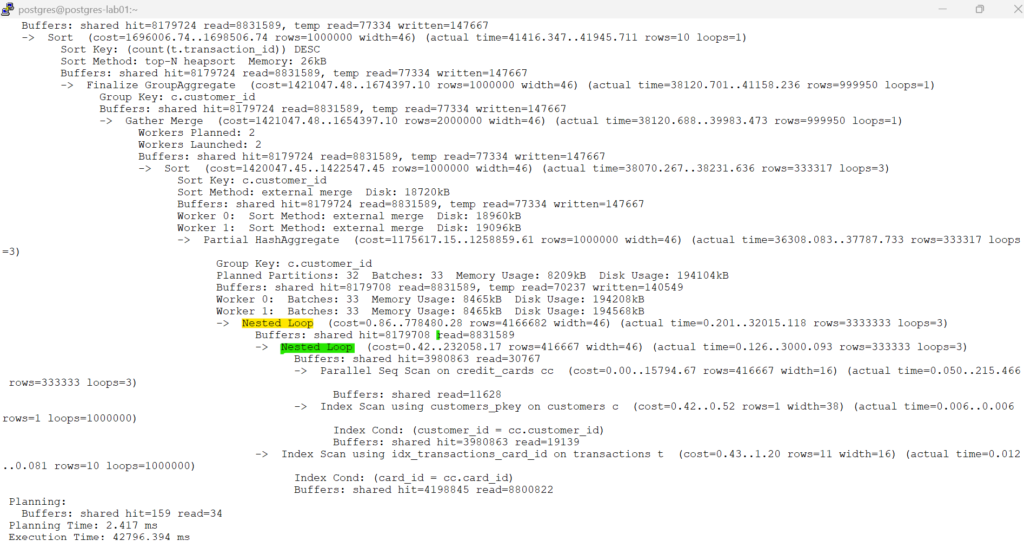
🧠 Key Takeaways
- PostgreSQL was forced to use Nested Loop Join for all table joins by disabling Merge Join and Hash Join.
- The join between customers and credit_cards switched from a Merge Join in the baseline plan to a Nested Loop Join.
🔥 Step 5 – Force a Hash Join
🎯 Goal
In this step, we will force PostgreSQL to use a Hash Join and compare its behavior with the Nested Loop Join and the baseline plan.
📚 Understanding Hash Join
A Hash Join works by building an in-memory hash table from one side of the join and then probing it with rows from the other side.
Instead of repeatedly searching for matching rows, PostgreSQL performs fast hash lookups.
✅ Strengths
- ⚡ Excellent for large equality joins
- ⚡ Reduces repeated lookups
- ⚡ Often the preferred choice for large datasets
⚠️ Limitations
- 🧠 Requires memory to build hash tables
- 📦 Large hash tables may spill to disk if memory is insufficient
- 🚫 Only useful for equality-based joins
🧪 Force PostgreSQL to Use a Hash Join
# To focus on Hash Join behavior, disable Nested Loop Join and Merge Join.
psql -p 5432 -U postgres -d creditcards -c "
SET enable_nestloop = off;
SET enable_mergejoin = off;
SET enable_hashjoin = on;
EXPLAIN (ANALYZE, BUFFERS)
SELECT
c.customer_id,
c.first_name,
c.last_name,
COUNT(t.transaction_id) AS transaction_count
FROM consumer.customers c
JOIN consumer.credit_cards cc
ON c.customer_id = cc.customer_id
JOIN consumer.transactions t
ON cc.card_id = t.card_id
GROUP BY
c.customer_id,
c.first_name,
c.last_name
ORDER BY transaction_count DESC
LIMIT 10;
"
Planning:
Buffers: shared hit=159 read=34
Planning Time: 4.226 ms
Execution Time: 28417.503 ms
(47 rows)
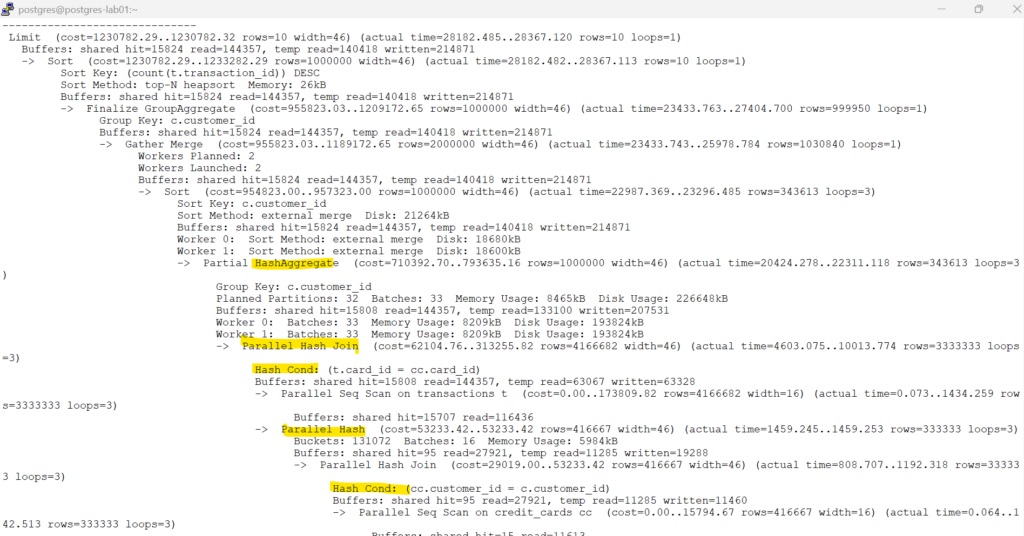
🧠 Key Takeaways
- 🔥 PostgreSQL used a Parallel Hash Join to join
transactionswith the result ofcustomers -> credit_cards. - 🧱 The join between
customersandcredit_cardsalso used a Parallel Hash Join. - ⚙️ PostgreSQL used 2 workers, so the work was split across 3 processes total including the leader.
- 📦 Both hash steps spilled to disk (
Batches,Disk Usage, andtemp read/writeare visible), which means memory was not enough to keep everything fully in memory. - ⏱️ Even with disk spill, the query finished in about 28.4 seconds, which is much faster than the 54 second Nested Loop plan.
PostgreSQL chose a Parallel Hash Join for this query, and the plan was significantly faster than the Nested Loop version. Both join steps used hash tables, but the hash operations spilled to disk because of memory limits. Even so, the query completed in about 28.4 seconds, showing that Hash Join was a much better fit for this workload.
🧭 Step 6 – Prepare for and Force a Merge Join
🎯 Goal
In this step, we will prepare the tables for a Merge Join and then force PostgreSQL to use it.
📚 Understanding Merge Join
A Merge Join works best when both inputs are already sorted on the join key.
Think of it like merging two ordered lists:
1, 2, 3, 4
1, 2, 3, 4PostgreSQL compares rows in order and moves forward together.
✅ Strengths
- 📚 Very efficient for sorted inputs
- 🚀 Works well when indexes support the join keys
- ⚡ Can be fast for large equality joins
⚠️ Limitations
- 🧱 Usually needs sorted input
- 📦 Sorting can add extra cost if indexes are missing
- 🔍 Not always the best choice for unsorted large tables
🧪 Force PostgreSQL to Use Merge Join
# Force PostgreSQL to use Merge Join:
psql -p 5432 -U postgres -d creditcards -c "
SET enable_hashjoin = off;
SET enable_nestloop = off;
SET enable_mergejoin = on;
EXPLAIN (ANALYZE, BUFFERS)
SELECT
c.customer_id,
c.first_name,
c.last_name,
COUNT(t.transaction_id) AS transaction_count
FROM consumer.customers c
JOIN consumer.credit_cards cc
ON c.customer_id = cc.customer_id
JOIN consumer.transactions t
ON cc.card_id = t.card_id
GROUP BY
c.customer_id,
c.first_name,
c.last_name
ORDER BY transaction_count DESC
LIMIT 10;
"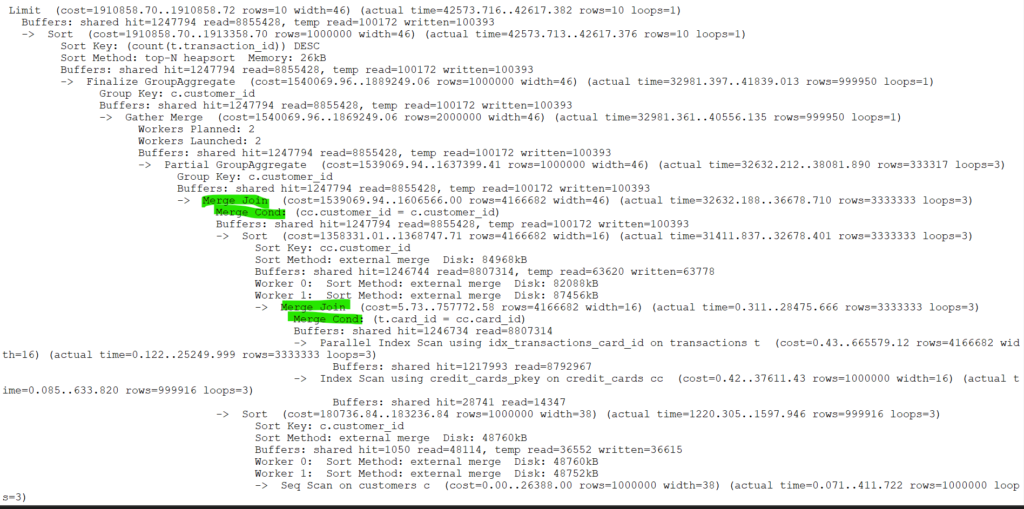
🧠 Key Takeaways
- 🟢 Merge Join Operations
- PostgreSQL used a Merge Join to combine the
transactionsandcredit_cardstables using thecard_idcolumn. - PostgreSQL then used another Merge Join to combine the result with the
customerstable using thecustomer_idcolumn. - A Merge Join works best when both inputs are sorted on the join columns.
- 🟡 Sort Operations
- Before the Merge Joins could occur, PostgreSQL had to sort the data on the join columns (
card_idandcustomer_id). - The sorted data was larger than the available memory, so PostgreSQL used an External Merge Sort, which means part of the sort was written to disk.
- The disk usage shown beside each sort operation indicates how much temporary disk space was used during the sorting process.
🎓 Key Takeaway
| Join Strategy | Join Operations Used | Additional Work Required | Execution Time |
|---|---|---|---|
| Baseline Plan | Merge Join (customers ↔ credit_cards) + Nested Loop (credit_cards ↔ transactions) | Sort required for Merge Join | 44.5 sec |
| Forced Nested Loop | Nested Loop (customers ↔ credit_cards) + Nested Loop (credit_cards ↔ transactions) | No sorting required, but 1M customer index lookups performed | 47.8 sec |
| Forced Merge Join | Merge Join (transactions ↔ credit_cards) + Merge Join (customers ↔ credit_cards) | Multiple large sorts spilled to disk | 42.7 sec |
| Forced Hash Join | Hash Join (customers ↔ credit_cards) + Hash Join (credit_cards ↔ transactions) | Hash tables built in memory | 28 sec |
🧠 Overall Observation
| Rank | Join Strategy | Execution Time |
|---|---|---|
| 🥇 1 | Hash Join | ~28 sec |
| 🥈 2 | Merge Join | ~42.7 sec |
| 🥉 3 | Baseline Plan | ~44.5 sec |
| 4 | Nested Loop | ~47.8 sec |
Key Learning
- Hash Join was the fastest strategy for this workload.
- Merge Join performed better than Nested Loop Join.
- The PostgreSQL optimizer’s default plan was good, but not the fastest in this specific scenario.
- Different join strategies can produce significantly different execution times even when returning the same result set.
🏹 Chapter 6 – Index Tuning Deep Dive
🏹 Chapter 6 – Index Tuning Deep Dive
📌 Goal
- 🎯 Understand single-column indexes
- 🎯 Understand composite indexes
- 🎯 Understand partial indexes
- 🎯 Understand expression indexes
- 🎯 Understand covering indexes
- 🔍 See the before index plan
- 🚀 See the after index plan
- 📈 Observe how the execution plan changes
📌 How PostgreSQL Decides to Use an Index
- 🧠 PostgreSQL uses a Query Planner before executing a query.
- 📊 The planner estimates how many rows will be returned.
- 💰 It compares the cost of an Index Scan versus a Sequential Scan.
- 🎯 PostgreSQL chooses the lowest-cost execution plan.
🔬 6.1 Baseline Query Performance (Before Indexes)
🎯 Goal
- 🔍 Observe the execution plan
- 📊 Capture baseline performance
- 🚨 Identify the bottleneck
- 🏹 Establish a before-and-after comparison
💻 Execute the Query
# Display the execution plan for first_name = 'Customer_594734'
psql -p 5432 -U postgres -d creditcards -c "
EXPLAIN (ANALYZE, BUFFERS)
SELECT
customer_id,
first_name,
last_name
FROM consumer.customers
WHERE first_name = 'Customer_594734';
"Gather (cost=1000.00..22596.43 rows=1 width=38) (actual time=5473.842..9087.951 rows=1 loops=1)
Workers Planned: 2
Workers Launched: 2
Buffers: shared read=16388
-> Parallel Seq Scan on customers (cost=0.00..21596.33 rows=1 width=38) (actual time=7835.074..9033.938 rows=0 loops=3)
Filter: ((first_name)::text = 'Customer_594734'::text)
Rows Removed by Filter: 333333
Buffers: shared read=16388
Planning:
Buffers: shared hit=46 read=20
Planning Time: 50.881 ms
Execution Time: 9094.326 ms
(12 rows)
| Item | Value | Why It Matters |
|---|---|---|
| 📖 Access Method | Parallel Seq Scan | PostgreSQL scanned the entire customers table. |
| ⏱️ Execution Time | 9,094.326 ms | Total query execution time (~9.1 seconds). |
| 🎯 Rows Returned | 1 | Only one row matched the filter condition. |
| 🚫 Rows Removed by Filter | 333,333 per worker | Most scanned rows were discarded. |
| ⚙️ Workers Launched | 2 | PostgreSQL used parallel execution. |
| 💾 Shared Buffer Hits | 0 | No data pages were served from cache. |
| 📥 Shared Buffer Reads | 16,388 | PostgreSQL had to read all required pages from disk. |
| 📝 Planning Time | 50.881 ms | Time spent generating the execution plan. |
PostgreSQL performed a Parallel Seq Scan on the entire table, read 16,388 pages from disk, discarded most rows, and returned only 1 matching row.
🏹 6.2 Single-Column Index
💻 Create the Index
# Create a single-column index
psql -p 5432 -U postgres -d creditcards -c "
CREATE INDEX idx_customers_state
ON consumer.customers(first_name);
"💻 Rerun the Same Query
# Run the same query again
psql -p 5432 -U postgres -d creditcards -c "
EXPLAIN (ANALYZE, BUFFERS)
SELECT
customer_id,
first_name,
last_name
FROM consumer.customers
WHERE first_name = 'Customer_594734';
"Index Scan using idx_customers_state on customers (cost=0.42..8.44 rows=1 width=38) (actual time=0.298..0.301 rows=1 loops=1)
Index Cond: ((first_name)::text = 'Customer_594734'::text)
Buffers: shared read=4
Planning:
Buffers: shared hit=84 read=4
Planning Time: 12.249 ms
Execution Time: 0.458 ms
(7 rows)
| Item | Value | Why It Matters |
|---|---|---|
| 📖 Access Method | Index Scan | PostgreSQL used the index instead of scanning the entire table. |
| 🎯 Index Used | idx_customers_state (consider renaming if created on first_name) | The index was used to locate the matching row directly. |
| ⏱️ Execution Time | 0.458 ms | Query completed almost instantly. |
| 🎯 Rows Returned | 1 | Exactly one matching row was found. |
| 💾 Shared Buffer Reads | 4 | Only 4 pages were read from disk. |
| 🔍 Index Condition | first_name = 'Customer_594734' | PostgreSQL used the index to satisfy the filter. |
| 📝 Planning Time | 12.249 ms | Time spent generating the execution plan. |
# Drop the single-column index
psql -p 5432 -U postgres -d creditcards -c "
DROP INDEX consumer.idx_customers_state;
"🚀 When a Single-Column Index Helps
- 🎯 The query filters on one column
- 🔎 The column is used often in
WHERE - 📉 The filter is selective enough
- ⚡ You want faster lookups on that column
🏹 6.3 Composite Index
🎯 Goal
- 🔨 Create an index on multiple columns
- 🧭 Understand why column order matters
- ▶️ Rerun the query
- 📈 Observe the execution plan improvement
📌 Why Composite Indexes?
- 🎯 Optimize queries that filter on multiple columns
- 🔍 Help PostgreSQL narrow down matching rows faster
- ⚡ Reduce unnecessary table reads
- 📊 Improve performance for multi-column search conditions
💻 Create the Composite Index
Create a composite index
# Create a composite index
psql -p 5432 -U postgres -d creditcards -c "
CREATE INDEX idx_customers_state_city
ON consumer.customers(state, city);
"✅ Demo 1: Filter on Both Columns
# Query uses both columns from the index
psql -p 5432 -U postgres -d creditcards -c "
EXPLAIN (ANALYZE, BUFFERS)
SELECT *
FROM consumer.customers
WHERE state = 'State_1'
AND city = 'City_1';
"Bitmap Heap Scan on customers (cost=9.81..1810.20 rows=525 width=98) (actual time=7.800..162.009 rows=10000 loops=1)
Recheck Cond: (((state)::text = 'State_1'::text) AND ((city)::text = 'City_1'::text))
Heap Blocks: exact=10000
Buffers: shared hit=137 read=9875
-> Bitmap Index Scan on idx_customers_state_city (cost=0.00..9.68 rows=525 width=0) (actual time=3.838..3.839 rows=10000 loops=1)
Index Cond: (((state)::text = 'State_1'::text) AND ((city)::text = 'City_1'::text))
Buffers: shared read=12
Planning:
Buffers: shared hit=105 read=1 dirtied=2
Planning Time: 3.313 ms
Execution Time: 164.768 ms
(11 rows)
🔍 What do we observe?
- PostgreSQL used the composite index correctly.
- The query filtered on both indexed columns, so the index matched the condition well.
- The query returned 10,000 rows, which is a fairly large result set.
- Because many rows matched, the query still had to do a lot of work to return them.
- This is a good example of a composite index helping with a multi-column filter.
✅ Demo 2: Filter on Leading Column Only
# Query uses only the first column
psql -p 5432 -U postgres -d creditcards -c "
EXPLAIN (ANALYZE, BUFFERS)
SELECT *
FROM consumer.customers
WHERE state = 'State_1';
"Bitmap Heap Scan on customers (cost=580.84..17614.68 rows=51667 width=98) (actual time=33.176..925.892 rows=50000 loops=1)
Recheck Cond: ((state)::text = 'State_1'::text)
Heap Blocks: exact=16388
Buffers: shared hit=9760 read=6674
-> Bitmap Index Scan on idx_customers_state_city (cost=0.00..567.93 rows=51667 width=0) (actual time=14.401..14.402 rows=50000 loops=1)
Index Cond: ((state)::text = 'State_1'::text)
Buffers: shared hit=12 read=34
Planning:
Buffers: shared hit=106
Planning Time: 3.644 ms
Execution Time: 941.263 ms
(11 rows)
🔍 What Do We Observe?
- PostgreSQL used the composite index even though only one column was specified in the filter.
- The query used the leading column (
state), allowing the index to be used efficiently. - Composite indexes can support queries that filter on the leftmost column of the index definition.
- This demonstrates the leftmost-prefix rule in PostgreSQL indexes.
⚠️ Demo 3: Filter on Second Column Only
# Query skips the leading column
psql -p 5432 -U postgres -d creditcards -c "
EXPLAIN (ANALYZE, BUFFERS)
SELECT *
FROM consumer.customers
WHERE city = 'City_1';
"Gather (cost=1000.00..23613.03 rows=10167 width=98) (actual time=4.568..189.111 rows=10000 loops=1)
Workers Planned: 2
Workers Launched: 2
Buffers: shared hit=16076 read=312
-> Parallel Seq Scan on customers (cost=0.00..21596.33 rows=4236 width=98) (actual time=0.052..151.464 rows=3333 loops=3)
Filter: ((city)::text = 'City_1'::text)
Rows Removed by Filter: 330000
Buffers: shared hit=16076 read=312
Planning:
Buffers: shared hit=106
Planning Time: 7.318 ms
Execution Time: 190.859 ms
(12 rows)
🔍 What do we observe?
- PostgreSQL did not use the
(state, city)index here. - The query skipped the first column of the index.
- Because of that, PostgreSQL chose a Parallel Seq Scan.
- This is a good example of why the order of columns in a composite index matters.
🧠 Simple takeaway
A composite index works best when the query starts with the leftmost column.
If the first column is skipped, PostgreSQL usually cannot use the index efficiently.
# Drop the composite index
psql -p 5432 -U postgres -d creditcards -c "
DROP INDEX consumer.idx_customers_state_city;
"🏹 6.4 Partial Index
🎯 Goal
- 🔨 Create an index on only a subset of rows
- ▶️ Rerun a filtered query
- 📊 Observe the execution plan
- ⚡ Understand why smaller indexes can be faster
📌 Why Partial Indexes?
- 🎯 Index only the rows that matter
- 💾 Reduce index size
- ⚡ Faster index scans
- 🔧 Lower maintenance overhead
💻 Create a Partial Index
# Create a partial index
psql -p 5432 -U postgres -d creditcards -c "
CREATE INDEX idx_customers_state1
ON consumer.customers(customer_id)
WHERE state = 'State_1';
"🎯 Lab Takeaway
We created the index on the customer_id column, but only for rows where state = 'State_1'. PostgreSQL excludes all other states from the index, making the index smaller and more focused than a regular index.
Display the execution plan
# Display the execution plan
psql -p 5432 -U postgres -d creditcards -c "
EXPLAIN (ANALYZE, BUFFERS)
SELECT customer_id
FROM consumer.customers
WHERE state = 'State_1';
"Index Only Scan using idx_customers_state1 on customers (cost=0.29..1322.96 rows=51667 width=8) (actual time=0.058..13.603 rows=50000 loops=1)
Heap Fetches: 0
Buffers: shared hit=139
Planning:
Buffers: shared hit=80
Planning Time: 0.739 ms
Execution Time: 19.712 ms
(7 rows)
🧠 Simple takeaway
A partial index is useful when you often query only a specific subset of rows. In this case, PostgreSQL used a smaller index and returned the results without touching the table heap.
🏹 6.5 Expression Index
🎯 Goal
- 🔨 Create an index on an expression
- 🔍 Execute a query using the same expression
- 📊 Observe the execution plan
- ⚡ Understand how PostgreSQL can index computed values
📌 Why Expression Indexes?
- 🔍 Some queries apply functions to columns
- 📖 Normal indexes may not help when a function is used
- ⚡ An expression index stores the computed result
- 🎯 PostgreSQL can use the index instead of evaluating every row
💻 Create an Expression Index
# Create an expression index
psql -p 5432 -U postgres -d creditcards -c "
CREATE INDEX idx_customers_email_lower
ON consumer.customers (LOWER(email));
"📋 Review the Execution Plan
# Display the execution plan
psql -p 5432 -U postgres -d creditcards -c "
EXPLAIN (ANALYZE, BUFFERS)
SELECT customer_id
FROM consumer.customers
WHERE LOWER(email) = 'customer100@example.com';
" Bitmap Heap Scan on customers (cost=163.18..10896.21 rows=5000 width=8) (actual time=0.158..0.160 rows=1 loops=1)
Recheck Cond: (lower((email)::text) = 'customer100@example.com'::text)
Heap Blocks: exact=1
Buffers: shared read=4
-> Bitmap Index Scan on idx_customers_email_lower (cost=0.00..161.93 rows=5000 width=0) (actual time=0.115..0.115 rows=1 loops=1)
Index Cond: (lower((email)::text) = 'customer100@example.com'::text)
Buffers: shared read=3
Planning:
Buffers: shared hit=91 read=1
Planning Time: 3.628 ms
Execution Time: 0.922 ms
(11 rows)
- PostgreSQL used the expression index
idx_customers_email_lower. - The query filtered on
LOWER(email), which matches the indexed expression. - Only a few pages were read to locate the matching row.
- The query completed in less than 1 millisecond, demonstrating the benefit of expression indexes for function-based searches.
💻 Drop the Expression Index
# Remove the expression index
psql -p 5432 -U postgres -d creditcards -c "
DROP INDEX consumer.idx_customers_email_lower;
"# Create a regular index on email
psql -p 5432 -U postgres -d creditcards -c "
CREATE INDEX idx_customers_email
ON consumer.customers(email);
"💻 Rerun the Same Query
# Execute the same query after dropping the expression index
psql -p 5432 -U postgres -d creditcards -c "
EXPLAIN (ANALYZE, BUFFERS)
SELECT customer_id
FROM consumer.customers
WHERE LOWER(email) = 'customer100@example.com';
"Gather (cost=1000.00..24138.00 rows=5000 width=8) (actual time=2.970..533.570 rows=1 loops=1)
Workers Planned: 2
Workers Launched: 2
Buffers: shared hit=16051 read=337
-> Parallel Seq Scan on customers (cost=0.00..22638.00 rows=2083 width=8) (actual time=333.827..502.024 rows=0 loops=3)
Filter: (lower((email)::text) = 'customer100@example.com'::text)
Rows Removed by Filter: 333333
Buffers: shared hit=16051 read=337
Planning:
Buffers: shared hit=90 read=1
Planning Time: 1.878 ms
Execution Time: 534.447 ms
(12 rows)
🔥 PostgreSQL matches the query expression to the indexed expression. A regular index on email cannot replace an expression index on LOWER(email).
# Remove the index
psql -p 5432 -U postgres -d creditcards -c "
DROP INDEX consumer.idx_customers_email;
"🏹 6.6 Covering Index
🎯 Goal
- 🔨 Create an index with
INCLUDE - ⚡ Show an Index Only Scan
- 📉 Reduce heap access
- 📊 Improve read performance
📌 Why Covering Indexes?
- 🎯 They store the filter columns plus the columns needed by the query
- 🔍 PostgreSQL can satisfy the query from the index itself
- 💾 Less heap access means less work
- 🚀 Faster reads for common lookup queries
💻 Create the Covering Index
# Create a covering index with INCLUDE
psql -p 5432 -U postgres -d creditcards -c "
CREATE INDEX idx_customers_state_city_cover
ON consumer.customers(state, city)
INCLUDE (customer_id, first_name, last_name);
"💻 Run the Query
# Query matches the index and only needs included columns
psql -p 5432 -U postgres -d creditcards -c "
EXPLAIN (ANALYZE, BUFFERS)
SELECT
customer_id,
first_name,
last_name
FROM consumer.customers
WHERE state = 'State_1'
AND city = 'City_1';
"Index Only Scan using idx_customers_state_city_cover on customers (cost=0.42..34.92 rows=525 width=38) (actual time=0.083..4.104 rows=10000 loops=1)
Index Cond: ((state = 'State_1'::text) AND (city = 'City_1'::text))
Heap Fetches: 0
Buffers: shared hit=1 read=96
Planning:
Buffers: shared hit=116 read=7
Planning Time: 0.951 ms
Execution Time: 4.603 ms
(8 rows)
🎯 Takeaway
- 🔨 A covering index stores the search columns plus extra needed columns
- 🏹 PostgreSQL can return results without touching the heap
- 💾
Heap Fetches: 0is the proof - ⚡ This is why covering indexes are great for read-heavy queries
# Remove the covering index
psql -p 5432 -U postgres -d creditcards -c "
DROP INDEX consumer.idx_customers_state_city_cover;
"📚 PostgreSQL Index Selection Guide
| Index Type | Best Used For | Example |
|---|---|---|
| 🎯 B-Tree (Default) | Equality and range searches | WHERE customer_id = 100 |
| 🎯 Composite Index | Multiple filter columns | WHERE state='CA' AND city='LA' |
| 🎯 Partial Index | Subset of rows | WHERE status='ACTIVE' |
| 🎯 Expression Index | Function-based searches | WHERE LOWER(email)=... |
| 🎯 Covering Index | Index-only scans | INCLUDE (...) |
| 🔍 GIN | Arrays, JSONB, Full-Text Search | WHERE tags @> ARRAY['postgres'] |
| 🌐 GiST | Geospatial and range data | PostGIS, date ranges |
| 🚀 SP-GiST | Hierarchical and partitioned search structures | IP ranges, spatial data |
| 📏 BRIN | Very large tables with ordered data | Timestamp-based tables |
| 🔒 Hash | Equality searches only | WHERE customer_id = 100 |
🧠 When Should I Use Which Index?
| Scenario | Recommended Index |
|---|---|
| 🔍 Search by ID | 🎯 B-Tree |
| 📅 Date ranges | 🎯 B-Tree |
| 🧩 Multiple filters | 🎯 Composite |
| 📌 Frequently queried subset | 🎯 Partial |
| 🔤 Function-based predicates | 🎯 Expression |
| 📖 Read-heavy lookups | 🎯 Covering |
| 📦 JSONB documents | 🔍 GIN |
| 📝 Full-text search | 🔍 GIN |
| 🌍 Geospatial data | 🌐 GiST |
| 🕒 Huge time-series tables | 📏 BRIN |
🎯 Rule of Thumb
| Question | Index Type |
|---|---|
| One column? | 🎯 B-Tree |
| Multiple columns? | 🎯 Composite |
| Only some rows matter? | 🎯 Partial |
| Function in WHERE clause? | 🎯 Expression |
| Need Index Only Scan? | 🎯 Covering |
| JSONB / Arrays? | 🔍 GIN |
| Spatial data? | 🌐 GiST |
| Massive append-only table? | 📏 BRIN |
💡 Chapter Takeaway
PostgreSQL offers many index types, but most OLTP workloads are primarily optimized using B-Tree, Composite, Partial, Expression, and Covering indexes. Specialized indexes such as GIN, GiST, and BRIN are designed for specific data access patterns and should be chosen based on workload requirements.
📉 Chapter 7 – Statistics and Query Planner
📉 Chapter 7 – Statistics and Query Planner
📌 Goal
Understand:
- 📊 ANALYZE
- 📊 Statistics collection
- 📊 Cardinality estimates
- 📊 Bad plans caused by stale statistics
🎯 7.1 Chapter Introduction
📌 Why Statistics Matter
PostgreSQL’s Query Planner is responsible for choosing the most efficient way to execute a query.
However, there is one important challenge:
🧠 PostgreSQL does not know exactly how many rows a query will return before it executes the query.
Instead, it makes an educated guess using statistics collected about the data stored in tables and indexes.
🧠 PostgreSQL Does Not Know the Future
When a query arrives, PostgreSQL must decide:
- 🎯 Which table should be accessed first?
- 🔗 Which join method should be used?
- 📚 Should an index be used?
- 📦 Should the table be scanned sequentially?
- ⚡ Which execution plan will be the fastest?
Since the actual result is not yet known, PostgreSQL relies on estimates.
These estimates come from statistical information maintained for each table and column.
📊 What Are Statistics?
Statistics are metadata that describe the distribution of data inside a table.
Examples include:
- 📈 Total number of rows
- 📊 Number of distinct values
- 🎯 Most common values
- 📉 Data distribution patterns
- 🔢 Percentage of NULL values
- 📦 Average row width
PostgreSQL stores this information internally and uses it during query planning.
🎯 Why Row Estimates Matter
The planner’s most important task is estimating:
📊 How many rows will be returned by each operation?
For example:
psql -p 5432 -U postgres -d creditcards -c "
SELECT
*
FROM consumer.transactions
WHERE city = 'City_1'
LIMIT 10;
"Before executing the query, PostgreSQL estimates:
- 📈 How many customers live in City_1
- 🎯 Whether an index would be beneficial
- ⚡ Whether a sequential scan would be cheaper
These estimates directly influence the execution plan selected.
⚡ Good Statistics Lead to Good Plans
When statistics accurately represent the data:
- 🎯 Cardinality estimates are accurate
- 📚 Appropriate indexes are chosen
- 🔗 Efficient join methods are selected
- ⚡ Queries execute faster
- 📉 Resource consumption is reduced
Result:
🚀 Better performance and more predictable query execution.
💥 Bad Statistics Lead to Bad Plans
When statistics become stale or inaccurate:
- ❌ Row estimates become incorrect
- ❌ Wrong join strategies may be chosen
- ❌ Indexes may be ignored
- ❌ Sequential scans may be selected unnecessarily
- ❌ Query performance can degrade dramatically
Result:
🐢 The planner may choose an execution plan that looks good on paper but performs poorly in reality.
🏹 What You’ll Learn in This Chapter
By the end of this chapter, you’ll understand:
- 📊 How PostgreSQL collects statistics
- 🔍 How
ANALYZEworks - 🎯 What cardinality estimation means
- 📈 How the planner predicts row counts
- 💥 How stale statistics cause bad plans
- 🛠️ How to identify and fix estimation problems
🚀 Key Takeaway
🧠 PostgreSQL’s Query Planner is only as smart as the statistics it has available.
🔬 7.2 Observe Planner Estimates
🎯 Goal
Understand how PostgreSQL predicts row counts by comparing:
- 📊 Estimated rows (
rows=) - 📈 Actual rows (
actual rows=) - 🧠 Planner predictions
- 🎯 Cardinality estimates
📌 Part 1 — Happy Path (Good Statistics)
Let’s start with a healthy database.
# Refresh statistics
psql -p 5432 -U postgres -d creditcards -c "
ANALYZE consumer.transactions;
"# Observe planner estimates
psql -p 5432 -U postgres -d creditcards -c "
EXPLAIN (ANALYZE, BUFFERS)
SELECT *
FROM consumer.transactions
WHERE city = 'City_1';
"Gather (cost=1000.00..194892.59 rows=96666 width=68) (actual time=0.994..62247.251 rows=100000 loops=1)
Workers Planned: 2
Workers Launched: 2
Buffers: shared hit=44 read=132099
-> Parallel Seq Scan on transactions (cost=0.00..184225.99 rows=40278 width=68) (actual time=1.050..61996.508 rows=33333 loops=3)
Filter: ((city)::text = 'City_1'::text)
Rows Removed by Filter: 3300000
Buffers: shared hit=44 read=132099
Planning:
Buffers: shared hit=116
Planning Time: 2.084 ms
Execution Time: 62395.420 ms
(12 rows)
📊 Observe the Estimates
| Metric | Value |
|---|---|
| 📊 Estimated Rows | 96,666 |
| 📈 Actual Rows | 100,000 |
🔍 Observation
PostgreSQL estimated that the query would return 96,666 rows, while the actual execution returned 100,000 rows. The estimate is very close to reality, indicating that the planner has accurate statistics for this data.
💥 Part 2 — Stale Statistics (Bad Estimates)
# Modify about 1,000,000 rows, just below Auto Analyze threshold
psql -p 5432 -U postgres -d creditcards -c "
UPDATE consumer.transactions
SET city = 'City_99'
WHERE transaction_id <= 11000000;
"# Observe stale planner estimates
psql -p 5432 -U postgres -d creditcards -c "
EXPLAIN (ANALYZE, BUFFERS)
SELECT *
FROM consumer.transactions
WHERE city = 'City_99';
"Gather (cost=1000.00..214309.28 rows=104952 width=68) (actual time=974.038..6037.560 rows=1090000 loops=1)
Workers Planned: 2
Workers Launched: 2
Buffers: shared hit=516 read=144960 dirtied=26309 written=22567
-> Parallel Seq Scan on transactions (cost=0.00..202814.08 rows=43730 width=68) (actual time=636.810..5657.791 rows=363333 loops=3)
Filter: ((city)::text = 'City_99'::text)
Rows Removed by Filter: 2970000
Buffers: shared hit=516 read=144960 dirtied=26309 written=22567
Planning:
Buffers: shared hit=82 read=30
Planning Time: 4.020 ms
Execution Time: 6275.228 ms
(12 rows)
📋 Stale Stats: Record Table
| Plan Node | Estimated Rows | Actual Rows | What It Shows |
|---|---|---|---|
📦 Gather | 104,952 | 1,090,000 | Final result returned by the query |
🔍 Parallel Seq Scan on transactions | 43,730 | 363,333 per worker | Each worker scanned part of the table |
✍️Note
After updating a large number of rows to City_99 without refreshing statistics, PostgreSQL still expected only about 105k rows, while the actual execution returned 1.09 million rows.
💥 Part 3 — Refresh Statistics
# Refresh statistics
psql -p 5432 -U postgres -d creditcards -c "
ANALYZE consumer.transactions;
"# Rerun the same query post Stats gather
psql -p 5432 -U postgres -d creditcards -c "
EXPLAIN (ANALYZE, BUFFERS)
SELECT *
FROM consumer.transactions
WHERE city = 'City_99';
"Seq Scan on transactions (cost=0.00..270766.84 rows=1138309 width=67) (actual time=12.949..3041.343 rows=1090000 loops=1)
Filter: ((city)::text = 'City_99'::text)
Rows Removed by Filter: 8910000
Buffers: shared hit=9865 read=135611
Planning:
Buffers: shared hit=108 read=4
Planning Time: 4.034 ms
Execution Time: 3111.829 ms
(8 rows)
🔍 Observation
After running ANALYZE, PostgreSQL estimated 1,138,309 rows and returned 1,090,000 rows. The estimate became much more accurate because the planner now had up-to-date statistics.
📈 Before vs After ANALYZE
| Scenario | Estimated Rows | Actual Rows | Accuracy |
|---|---|---|---|
| 😀 Fresh Statistics | 96,666 | 100,000 | Excellent |
| 💥 Stale Statistics | 104,952 | 1,090,000 | Poor |
| 🔧 After ANALYZE | 1,138,309 | 1,090,000 | Excellent |
🚀 Key Takeaway
PostgreSQL does not know how many rows a query will return. It predicts the result using table statistics. When those statistics become stale, the planner can make poor estimates. Running
ANALYZErefreshes the statistics and helps the planner make more accurate decisions.
📊 7.3 Understanding ANALYZE
🎯 Goal
Understand how PostgreSQL refreshes planner statistics.
Learn:
- 🔨 How to run
ANALYZE - 📊 How statistics are refreshed
- 🔍 How to verify statistics updates
- ⚡ Why accurate statistics improve query planning
Before running ANALYZE, let’s inspect the current statistics available to the planner.
# Check last statistics collection time
psql -p 5432 -U postgres -d creditcards -c "
SELECT
relname,
last_analyze,
last_autoanalyze
FROM pg_stat_user_tables
WHERE schemaname = 'consumer'
AND relname = 'customers';
"# Collect fresh statistics
psql -p 5432 -U postgres -d creditcards -c "
ANALYZE consumer.customers;
"# Check statistics collection time again
psql -p 5432 -U postgres -d creditcards -c "
SELECT
relname,
last_analyze,
last_autoanalyze
FROM pg_stat_user_tables
WHERE schemaname = 'consumer'
AND relname = 'customers';
"relname | last_analyze | last_autoanalyze
-----------+-------------------------------+------------------
customers | 2026-06-15 20:35:34.075644+00 |
(1 row)
🔍 Observation
The
last_analyzetimestamp was updated, confirming that PostgreSQL refreshed the planner statistics.
📋 7.4 Inspect Collected Statistics
- 🔍 Where statistics are stored
- 📊 Distinct value information
- 📈 Common value information
- 🧠 How the planner uses these statistics
📌 View Collected Statistics
# Display statistics information
psql -p 5432 -U postgres -d creditcards -c "
SELECT
attname,
n_distinct,
most_common_vals
FROM pg_stats
WHERE schemaname = 'consumer'
AND tablename = 'customers';
" created_date | 1 | {"2026-06-11 17:17:11.489875"}
customer_id | -1 |
first_name | -1 |
state | 20 | {State_18,State_0,State_19,State_10,State_12,State_7,State_11,State_14,State_4,State_13,State_17,State_16,State_15,State_2,State
_5,State_3,State_8,State_6,State_9,State_1}
last_name | -1 |
email | -1 |
phone_number | -1 |
city | 100 | {City_35,City_79,City_91,City_93,City_27,City_60,City_10,City_58,City_80,City_54,City_18,City_90,City_36,City_97,City_2,City_25,
City_48,City_67,City_59,City_84,City_24,City_32,City_41,City_42,City_38,City_73,City_3,City_44,City_57,City_82,City_98,City_66,City_72,City_1,City_34,City_63
,City_37,City_39,City_74,City_76,City_40,City_45,City_89,City_52,City_12,City_11,City_19,City_8,City_83,City_85,City_92,City_14,City_50,City_86,City_96,City_
70,City_0,City_51,City_88,City_20,City_15,City_29,City_33,City_69,City_71,City_47,City_6,City_7,City_26,City_4,City_17,City_78,City_53,City_56,City_95,City_2
2,City_31,City_9,City_21,City_5,City_87,City_23,City_68,City_43,City_16,City_46,City_55,City_94,City_28,City_30,City_61,City_49,City_64,City_65,City_77,City_
13,City_81,City_75,City_99,City_62}
🔍 What Do These Statistics Tell Us?
| Column | Statistic Observed | What PostgreSQL Learned |
|---|---|---|
📅 created_date | n_distinct = 1 | All rows have the same timestamp value |
🆔 customer_id | n_distinct = -1 | Almost every row has a unique value |
👤 first_name | n_distinct = -1 | Most values are unique |
👤 last_name | n_distinct = -1 | Most values are unique |
📧 email | n_distinct = -1 | Almost every email is unique |
📞 phone_number | n_distinct = -1 | Almost every phone number is unique |
🏙️ city | n_distinct = 100 | 100 different cities exist in the table |
🗺️ state | n_distinct = 20 | 20 different states exist in the table |
📊 Understanding n_distinct
| Value | Meaning |
|---|---|
| 📊 Positive Number | Estimated number of distinct values |
📈 -1 | Nearly every row contains a unique value |
| 📉 Small Number | Many rows share the same values |
🔍 Observation
PostgreSQL estimates that the
customerstable contains 20 distinct states and 100 distinct cities. For columns such asphone_number, andcustomer_id, almost every row contains a unique value.
🚀 Key Takeaway
pg_statscontains statistical information collected byANALYZE. PostgreSQL uses these statistics to estimate row counts and choose efficient execution plans.
🎯 Chapter Takeaway
- 🧠 PostgreSQL relies on statistics, not guesses
- 📊 Cardinality estimates drive plan selection
- 🚨 Bad statistics can produce bad plans
- 🔄 ANALYZE helps the planner make better decisions
🧠 Chapter 8 – Memory Tuning for Queries
🧠 Chapter 8 – Memory Tuning for Queries
📌 Goal
Understand how PostgreSQL uses memory during query execution and how memory settings influence query performance.
- 🧠
work_mem - 🧠
shared_buffers - 🧠
maintenance_work_mem - 🧠
effective_cache_size
💡 Not all slow queries are CPU problems or indexing problems. Many performance issues occur because PostgreSQL runs out of working memory and starts using disk instead.
🎯 8.1 Chapter Introduction
- 🧠 PostgreSQL uses memory to reduce expensive disk I/O.
- 📊 Sort operations require memory for ordering data.
- 📊 Hash operations require memory for joins and aggregations.
- 📁 Insufficient memory causes temporary files and disk spills.
- ⚡ Proper memory tuning can dramatically improve query performance.
- 🎯 Different memory parameters serve different purposes and workloads.
🔍 8.2 Inspect Current Memory Configuration
View the current PostgreSQL memory configuration and understand the purpose of the most important memory parameters.
# Display important memory settings
psql -p 5432 -U postgres -d creditcards -x -c "
SELECT
current_setting('work_mem') AS work_mem,
current_setting('shared_buffers') AS shared_buffers,
current_setting('maintenance_work_mem') AS maintenance_work_mem,
current_setting('effective_cache_size') AS effective_cache_size;
"-[ RECORD 1 ]--------+------
work_mem | 4MB
shared_buffers | 128MB
maintenance_work_mem | 64MB
effective_cache_size | 4GB
| Parameter | Purpose |
|---|---|
🧠 work_mem | Memory for sorts, hashes, and aggregations |
🧠 shared_buffers | PostgreSQL’s data cache |
🧠 maintenance_work_mem | Memory for maintenance operations |
🧠 effective_cache_size | Planner estimate of available cache |
🧠 8.3 Understanding work_mem
🎯 Goal
Understand how PostgreSQL uses work_mem during query execution and why it is one of the most important performance tuning parameters.
📖 What is work_mem?
work_mem defines the amount of memory PostgreSQL can use for certain query operations before it starts writing temporary data to disk.
When an operation requires more memory than the configured work_mem, PostgreSQL creates temporary files and performs the operation using disk storage, which is significantly slower than memory.
🔍 Where is work_mem Used?
PostgreSQL uses work_mem for several execution plan operations:
| Operation | Description |
|---|---|
| 📊 Sort | ORDER BY, DISTINCT, Merge Join sorting |
| 🔗 Hash Join | Building hash tables for joins |
| 📦 Hash Aggregate | GROUP BY and aggregation using hashing |
| 📋 Materialize | Storing intermediate query results |
⚠️ Important Note
work_mem is allocated per operation, not per query.
A single query may contain multiple sort and hash operations, causing PostgreSQL to use several times the configured work_mem.
For example:
- 📊 Sort #1 → 64 MB
- 📊 Sort #2 → 64 MB
- 🔗 Hash Join → 64 MB
Total memory consumption:
64 MB + 64 MB + 64 MB = 192 MB💡 Key Takeaways
- 🧠
work_memcontrols memory used by query execution operators. - 📊 Sorts and hashes are the most common consumers.
- 📁 Exceeding
work_memcauses temporary files and disk spills. - ⚡ Increasing
work_memcan significantly improve query performance. - ⚠️
work_memis allocated per operation, not per query.
💥 8.4 Sort Spill Demo
🎯 Goal
When PostgreSQL cannot perform a sort entirely in memory, it writes intermediate data to temporary files on disk. This process is known as a sort spill.
🛠️ Step 1 — Force a Small work_mem
Configure a very small memory limit for the current session:
# Set a small work_mem value of 1 MB
psql -p 5432 -U postgres -d creditcards -c "
SET work_mem = '1MB';
EXPLAIN (ANALYZE, BUFFERS)
SELECT *
FROM consumer.transactions
ORDER BY transaction_amount;
"Gather Merge (cost=1332698.19..2307250.47 rows=8352722 width=67) (actual time=13646.532..23286.146 rows=10000000 loops=1)
Workers Planned: 2
Workers Launched: 2
Buffers: shared hit=9969 read=135579, temp read=410553 written=411843
-> Sort (cost=1331698.17..1342139.07 rows=4176361 width=67) (actual time=12969.361..14500.438 rows=3333333 loops=3)
Sort Key: transaction_amount
Sort Method: external merge Disk: 275392kB
Buffers: shared hit=9969 read=135579, temp read=410553 written=411843
Worker 0: Sort Method: external merge Disk: 275904kB
Worker 1: Sort Method: external merge Disk: 269840kB
-> Parallel Seq Scan on transactions (cost=0.00..187239.61 rows=4176361 width=67) (actual time=15.672..649.991 rows=3333333 loops=3)
Buffers: shared hit=9897 read=135579
Planning:
Buffers: shared hit=134
Planning Time: 1.910 ms
Execution Time: 24080.528 ms
(16 rows)
| Observation | Meaning |
|---|---|
| Workers Planned: 2 | The planner expected parallel execution. |
| Workers Launched: 2 | Both workers actually ran. |
| Sort Method: external merge | This is the key sign of a spill. |
| Disk: 275392kB | Large temporary disk usage. |
| temp read/written | Temporary files were actively used. |
| Execution Time: 24080 ms | The spill made the query much slower. |
🎯 Observation
The sort exceeded the available
work_mem, causing PostgreSQL to perform an external merge sort and use temporary files on disk. This additional disk I/O increased query execution time.
⚡ 8.5 Fix Sort Spill
🎯 Goal
Increase work_mem and show how PostgreSQL can complete the sort in memory instead of spilling to disk.
# Increase work_mem to 2048 MB
psql -p 5432 -U postgres -d creditcards -c "
SET work_mem = '2GB';
EXPLAIN (ANALYZE, BUFFERS)
SELECT *
FROM consumer.transactions
ORDER BY transaction_amount;
"Sort (cost=1411256.73..1436314.90 rows=10023267 width=67) (actual time=8916.448..11437.614 rows=10000000 loops=1)
Sort Key: transaction_amount
Sort Method: quicksort Memory: 1405324kB
Buffers: shared hit=10220 read=135259
-> Seq Scan on transactions (cost=0.00..245708.67 rows=10023267 width=67) (actual time=0.029..1122.591 rows=10000000 loops=1)
Buffers: shared hit=10217 read=135259
Planning:
Buffers: shared hit=134
Planning Time: 1.304 ms
Execution Time: 12110.279 ms
(10 rows)
What changed at work_mem = 2GB
| Field | Meaning |
|---|---|
Sort Method: quicksort | The sort stayed in memory |
Memory: 1405324kB | PostgreSQL used about 1.4 GB of memory for the sort |
No Disk: line | No temporary file spill occurred |
Higher work_mem reduced disk I/O and improved performance by allowing the sort to finish in memory.
| Scenario | Sort Method | Result |
|---|---|---|
💥 Low work_mem | External Merge | Spilled to disk |
⚡ 2 GB work_mem | Quicksort | Completed in memory |
🔗 8.6 Hash Spill Demo
🎯 Goal
When a hash table becomes too large to fit in memory, PostgreSQL partitions the data into batches and writes portions of the hash table to temporary files on disk.
Force a Small work_mem –1 MB
Configure a very small memory limit for the current session:
# Demonstrate a hash spill
psql -p 5432 -U postgres -d creditcards -c "
SET work_mem = '1MB';
EXPLAIN (ANALYZE, BUFFERS)
SELECT
t.transaction_id,
c.customer_id
FROM consumer.transactions t
JOIN consumer.credit_cards cc
ON t.card_id = cc.card_id
JOIN consumer.customers c
ON cc.customer_id = c.customer_id;
"Hash Join (cost=81398.43..584287.47 rows=10023267 width=16) (actual time=1213.210..12360.844 rows=10000000 loops=1)
Hash Cond: (cc.customer_id = c.customer_id)
Buffers: shared hit=8883 read=150957, temp read=92758 written=92758
-> Hash Join (cost=39011.00..413797.86 rows=10023267 width=16) (actual time=691.086..7950.914 rows=10000000 loops=1)
Hash Cond: (t.card_id = cc.card_id)
Buffers: shared hit=8878 read=148226, temp read=46852 written=46852
-> Seq Scan on transactions t (cost=0.00..245708.67 rows=10023267 width=16) (actual time=0.020..2162.373 rows=10000000 loops=1)
Buffers: shared hit=8878 read=136598
-> Hash (cost=21628.00..21628.00 rows=1000000 width=16) (actual time=690.748..690.750 rows=1000000 loops=1)
Buckets: 65536 Batches: 32 Memory Usage: 1982kB
Buffers: shared read=11628, temp written=4240
-> Seq Scan on credit_cards cc (cost=0.00..21628.00 rows=1000000 width=16) (actual time=1.230..443.499 rows=1000000 loops=1)
Buffers: shared read=11628
-> Hash (cost=25980.42..25980.42 rows=1000000 width=8) (actual time=521.603..521.603 rows=1000000 loops=1)
Buckets: 65536 Batches: 32 Memory Usage: 1737kB
Buffers: shared hit=5 read=2731, temp written=3294
-> Index Only Scan using customers_pkey on customers c (cost=0.42..25980.42 rows=1000000 width=8) (actual time=0.038..246.394 rows=1000000 loops=1
)
Heap Fetches: 0
Buffers: shared hit=5 read=2731
Planning:
Buffers: shared hit=289 read=18
Planning Time: 21.593 ms
Execution Time: 12793.252 ms
(23 rows)
🔍 Hash Spill Demo — Important Observations
| Item | Meaning |
|---|---|
Hash | PostgreSQL built a hash table for the join |
Buckets: 65536 | Hash table bucket count |
Batches: 32 | The hash table did not fit in memory and was split into 32 batches |
Memory Usage: 1982kB | Very small in-memory hash space was available |
temp written=4240 | Temporary files were written while building the hash |
temp read=92758 written=92758 | Confirmed heavy temporary file activity during execution |
📌PostgreSQL could not keep the hash tables in memory, so it divided the work into batches and spilled to temporary files on disk.
⚡ 8.7 Fix Hash Spill
🎯 Goal
Increase work_mem and let us see how PostgreSQL can keep the hash table in memory instead of spilling to disk.
# Increase work_mem to 256 MB
psql -p 5432 -U postgres -d creditcards -c "
SET work_mem = '256MB';
EXPLAIN (ANALYZE, BUFFERS)
SELECT
t.transaction_id,
c.customer_id
FROM consumer.transactions t
JOIN consumer.credit_cards cc
ON t.card_id = cc.card_id
JOIN consumer.customers c
ON cc.customer_id = c.customer_id;
" Hash Join (cost=72608.43..370939.47 rows=10023267 width=16) (actual time=2204.831..26101.138 rows=10000000 loops=1)
Hash Cond: (cc.customer_id = c.customer_id)
Buffers: shared hit=11679 read=148161
-> Hash Join (cost=34128.00..306147.86 rows=10023267 width=16) (actual time=1175.696..15197.240 rows=10000000 loops=1)
Hash Cond: (t.card_id = cc.card_id)
Buffers: shared hit=8943 read=148161
-> Seq Scan on transactions t (cost=0.00..245708.67 rows=10023267 width=16) (actual time=0.047..3254.143 rows=10000000 loops=1)
Buffers: shared hit=8911 read=136565
-> Hash (cost=21628.00..21628.00 rows=1000000 width=16) (actual time=1171.952..1171.955 rows=1000000 loops=1)
Buckets: 1048576 Batches: 1 Memory Usage: 55067kB
Buffers: shared hit=32 read=11596
-> Seq Scan on credit_cards cc (cost=0.00..21628.00 rows=1000000 width=16) (actual time=2.788..465.506 rows=1000000 loops=1)
Buffers: shared hit=32 read=11596
-> Hash (cost=25980.42..25980.42 rows=1000000 width=8) (actual time=1004.768..1004.769 rows=1000000 loops=1)
Buckets: 1048576 Batches: 1 Memory Usage: 47255kB
Buffers: shared hit=2736
-> Index Only Scan using customers_pkey on customers c (cost=0.42..25980.42 rows=1000000 width=8) (actual time=0.095..388.954 rows=1000000 loops=1
)
Heap Fetches: 0
Buffers: shared hit=2736
Planning:
Buffers: shared hit=307
Planning Time: 6.337 ms
Execution Time: 27160.224 ms
(23 rows)
🔍 Hash Spill Fix — Plan Analysis
| Item | Meaning |
|---|---|
Batches: 1 | The hash table fit in memory |
Memory Usage: 55067kB | About 55 MB was used for the hash build |
No temp read / temp written | No temporary file spill occurred |
Buckets: 1048576 | PostgreSQL allocated a larger hash table structure |
work_mem = 256MB | Enough memory was available for the hash joins |
💡 Observation
Increasing
work_memallowed PostgreSQL to build the hash table in memory, reducing or eliminating temporary file usage and improving performance.
✅ Key Point
- Multiple batches means the hash did not fit in memory.
Batches: 1means the hash stayed in memory.- No temp I/O means the spill was fixed.
📁 8.8 Temporary Files
🎯 Goal
Observe how much temporary file activity PostgreSQL has generated for the current database.
# Display temp file statistics
psql -p 5432 -U postgres -d creditcards -c "
SELECT
datname,
temp_files,
ROUND(temp_bytes / 1024.0 / 1024.0 / 1024.0, 2) AS temp_gb
FROM pg_stat_database
WHERE datname = 'creditcards';
"datname | temp_files | temp_gb -------------+------------+--------- creditcards | 270 | 4.75 (1 row)
🎯 PostgreSQL has created 270 temporary files and written approximately 4.75 GB of temporary data, indicating significant disk spill activity from operations such as sorts and hash joins.
📊 Observation
| Column | Meaning |
|---|---|
📁 temp_files | Number of temporary files created |
💾 temp_bytes | Total size of temporary data written |
💡 Key Point
These values help you confirm that PostgreSQL has been using temporary disk space for operations such as sort spills and hash spills.
🧠 8.9 Understanding shared_buffers
🎯 Goal
Understand how PostgreSQL caches table and index pages in memory using shared_buffers.
# Display the current setting
psql -p 5432 -U postgres -d creditcards -c "
SHOW shared_buffers;
"# look for shared hit and read
psql -p 5432 -U postgres -d creditcards -c "
EXPLAIN (ANALYZE, BUFFERS)
SELECT *
FROM consumer.payments;
"Seq Scan on payments (cost=0.00..55000.00 rows=3000000 width=34) (actual time=2.798..2420.512 rows=3000000 loops=1)
Buffers: shared read=25000
Planning:
Buffers: shared hit=61 read=2
Planning Time: 6.671 ms
Execution Time: 2798.533 ms
(6 rows)
📖 What is shared_buffers?
shared_buffers is PostgreSQL’s primary memory cache for table and index pages.
When PostgreSQL reads data from disk, the pages are stored in shared_buffers so they can be reused by future queries.
🔍 Why is shared_buffers Important?
- 📦 Stores table and index pages in memory
- 📊 Keeps frequently accessed data readily available
- ⚡ Reduces physical disk reads
- 💾 Improves overall query performance
🎯 Key Takeaways
- 📦
shared_buffersis PostgreSQL’s internal cache. - 📊 Frequently accessed pages can remain in memory.
- ⚡ Cached pages are faster to access than disk pages.
- 💾 Proper sizing helps reduce I/O activity.
🧠 8.10 Understanding maintenance_work_mem
🎯 Goal
Understand how PostgreSQL uses maintenance_work_mem for maintenance operations.
# Check maintenance_work_mem
psql -p 5432 -U postgres -d creditcards -c "
SHOW maintenance_work_mem;
"maintenance_work_mem
----------------------
64MB
📖 What is maintenance_work_mem?
maintenance_work_mem defines the amount of memory PostgreSQL can use for maintenance tasks.
Unlike work_mem, this setting is not used by normal query operations such as sorts and hash joins.
🔍 Where is maintenance_work_mem Used?
| Operation | Purpose |
|---|---|
| 🔨 VACUUM | Cleanup of dead tuples |
| 🔨 CREATE INDEX | Building new indexes |
| 🔨 REINDEX | Rebuilding existing indexes |
| 🔨 ALTER TABLE | Certain table maintenance operations |
⚡ Why Is It Important?
- 🔨 More memory can speed up index creation.
- 🔨 More memory can improve VACUUM efficiency.
- 📁 Reduces temporary file usage during maintenance tasks.
- ⚡
Can shorten maintenance windows.
🧠 8.11 Understanding effective_cache_size
🎯 Goal
Understand how effective_cache_size influences PostgreSQL planner decisions.
# Check effective_cache_size
psql -p 5432 -U postgres -d creditcards -c "
SHOW effective_cache_size;
"effective_cache_size
----------------------
4GB
(1 row)
📖 What is effective_cache_size?
effective_cache_size is the planner’s estimate of how much data can be cached in memory.
Unlike shared_buffers, it does not reserve or allocate memory.
🔍 Why is it Important?
- 📊 Helps the planner estimate available cache
- 🎯 Influences query cost calculations
- ⚡ Can affect index scan versus sequential scan decisions
🎯 Key Takeaways
- 📊 Used by the query planner
- 🚫 Does not allocate memory
- 🎯 Influences plan selection and cost estimates
- ⚡ Should reflect the amount of memory available for caching
💡 Remember
effective_cache_sizeis a planner hint, not an actual memory allocation.
🏁 8.12 Chapter Summary
In this chapter, you explored how PostgreSQL uses memory during query execution and how memory settings influence performance.
📊 Memory Parameters Overview
| Parameter | Primary Use |
|---|---|
🧠 work_mem | Sorts, hash joins, and aggregations |
📦 shared_buffers | PostgreSQL data cache |
🔨 maintenance_work_mem | VACUUM, CREATE INDEX, REINDEX |
📊 effective_cache_size | Planner cache estimates |
- 🧠
work_memcontrols memory used by query operators. - 📊 Insufficient memory can cause sort spills and hash spills.
- 📁 Temporary files indicate that PostgreSQL is using disk instead of memory.
- 📦
shared_bufferscaches table and index pages. - 🔨
maintenance_work_memsupports maintenance operations. - 📊
effective_cache_sizehelps the planner estimate cache availability.
💡 Key Takeaway
Memory tuning is primarily about preventing unnecessary disk I/O.
When PostgreSQL cannot keep data structures in memory, it creates temporary files and performs additional disk operations. These spills often increase query execution time and can become a significant performance bottleneck.
Common warning signs include:
- 📁 Temporary file creation
- 💥 Sort spills
- 🔗 Hash spills
- 🐢 Unexpected query slowdowns
🔒 Chapter 9 – Locking, Blocking and Wait Events
🔒 Chapter 9 – Locking, Blocking and Wait Events
📌 Goal
Understand how PostgreSQL coordinates concurrent access to data and how to diagnose locking problems.
- 🔐 Locks and lock types
- 🔐 Blocking sessions
- 🔐 Lock waits
- 💀 Deadlocks
- 👀 Wait events
- 🔎 Monitoring active sessions
🎯 9.1 Chapter Introduction
📌 Why Locks Matter
- 🔐 PostgreSQL uses locks to protect data consistency
- 👥 Multiple sessions can access the same tables simultaneously
- ⏳ Conflicting operations may wait
- 💀 Poor concurrency can lead to deadlocks
- 🔎 PostgreSQL provides tools to diagnose lock issues
🔍 9.2 Inspect Active Sessions
🎯 Goal
# Display active PostgreSQL sessions
psql -p 5432 -U postgres -d creditcards -c "
SELECT
pid,
usename,
state,
query
FROM pg_stat_activity;
"pid | usename | state | query
------+----------+--------+-----------------------------
5030 | | |
5031 | postgres | |
6585 | postgres | active | +
| | | SELECT +
| | | pid, +
| | | usename, +
| | | state, +
| | | query +
| | | FROM pg_stat_activity; +
Understanding pg_stat_activity
The pg_stat_activity view displays information about every session currently connected to PostgreSQL. It is one of the most important monitoring views because it shows who is connected, what they are doing, and whether they are actively running queries.
When troubleshooting performance issues, lock waits, or blocking sessions, this is usually the first place a DBA looks.
Key Columns
| Column | Description |
|---|---|
pid | Unique process ID for the session |
usename | Connected PostgreSQL user |
state | Current session state |
query | Current or most recent SQL statement |
Session States
| State | Meaning |
|---|---|
active | Currently executing a query |
idle | Connected but not running a query |
idle in transaction | Transaction is open but not doing work |
What to Observe
- • 👤 Every session has a unique PID
- • 🏃 Active sessions are currently executing work
- • 😴 Idle sessions are simply waiting for the next command
- • ⚠️ Idle transactions can be dangerous because they may continue holding locks
- • 🔎 The query column helps identify what each session is doing
Why This Matters
🔎 Before investigating blocking sessions, lock waits, or deadlocks, you first need to identify the active sessions involved. The
pg_stat_activityview provides that visibility.
🔐 9.3 Understanding PostgreSQL Locks
PostgreSQL uses locks to ensure that multiple sessions can work with the same data safely and consistently. Most locks are acquired automatically and released when a transaction completes.
| Lock Type | Purpose |
|---|---|
| 📝 Row Locks | Protect individual rows being modified |
| 🗄️ Table Locks | Protect entire tables during certain operations |
| 🔄 Transaction Locks | Coordinate transaction activity and visibility |
📝 Row Locks
Row locks are acquired when a transaction modifies data using operations such as:
- ✏️ UPDATE
- ❌ DELETE
- 🔒 SELECT … FOR UPDATE
A row lock prevents other transactions from modifying the same row until the current transaction completes.
🔐 Row locks allow multiple users to work on the same table while protecting individual rows from conflicting changes.
🗄️ Table Locks
PostgreSQL automatically acquires table-level locks during many operations, including:
- 📖 SELECT
- ➕ INSERT
- ✏️ UPDATE
- ❌ DELETE
- 🛠️ ALTER TABLE
- 🧹 VACUUM
Most table locks allow concurrent access, but some operations require stronger locks that can temporarily block other sessions.
🔐 Table locks help PostgreSQL coordinate operations that affect an entire table.
🔄 Transaction Locks
Every transaction acquires internal locks that help PostgreSQL maintain consistency between concurrent sessions.
These locks remain active until the transaction is:
- ✅ COMMITTED
- ↩️ ROLLED BACK
🔐 Locks are typically held for the duration of a transaction and released when the transaction ends.
🚫 9.4 Blocking Session Demo
🎯 Goal
Create a blocking scenario and observe how PostgreSQL handles conflicting updates.
Session A
Open a new terminal and start a transaction.
# Session A: Login to the database
psql -p 5432 -U postgres -d creditcards--Session A: Acquire a row lock and keep it open
BEGIN;
UPDATE consumer.customers
SET state = 'Blocked'
WHERE customer_id = 100;Do not commit the transaction.
Session B
Open a second terminal and attempt to update the same row.
# Session B: Login to the database
psql -p 5432 -U postgres -d creditcards-- Session B: Attempt to update the same row
UPDATE consumer.customers
SET state = 'Waiting'
WHERE customer_id = 100;Observe
The second session does not return immediately.
Instead, the statement appears to hang while waiting for the lock held by Session A.
⏳ Session B is waiting for Session A to release the lock before it can continue.
What Happened?
| Session | Status |
|---|---|
| 🔐 Session A | Owns the row lock |
| ⏳ Session B | Waiting for the lock |
| 📝 Row 100 | Locked until Session A completes |
Why This Happens
When Session A updates the row, PostgreSQL acquires a row lock on that record.
When Session B attempts to update the same row, PostgreSQL prevents the conflicting modification and places Session B into a wait state.
🔐 PostgreSQL protects data consistency by allowing only one transaction to modify a row at a time.
💡 Most blocking problems in production are caused by transactions that hold locks longer than necessary.
⏳ Leave both sessions running. We will use this blocking scenario in the next lab to investigate lock waits.
👀 9.5 Detect Blocking with pg_stat_activity
🎯 Goal
Identify sessions that are currently waiting and determine the reason for the wait.
While Session B is still blocked from the previous lab, run in Session A:
-- Display sessions that are currently waiting
SELECT
pid,
wait_event_type,
wait_event,
query
FROM pg_stat_activity
WHERE wait_event IS NOT NULL;pid | wait_event_type | wait_event | query
------+-----------------+---------------------+-----------------------------
5030 | Activity | AutoVacuumMain |
5031 | Activity | LogicalLauncherMain |
6401 | Client | ClientRead | SELECT +
| | | name, +
| | | setting, +
| | | unit, +
| | | source +
| | | FROM pg_settings +
| | | WHERE name IN +
| | | ( +
| | | 'shared_buffers', +
| | | 'work_mem', +
| | | 'maintenance_work_mem',+
| | | 'effective_cache_size' +
| | | );
6797 | Lock | transactionid | UPDATE consumer.customers +
| | | SET state = 'Waiting' +
| | | WHERE customer_id = 100;
What to Observe
Look for a session where:
| Column | Expected Value |
|---|---|
| wait_event_type | Lock |
| wait_event | transactionid (or another lock-related wait) |
| query | The blocked UPDATE statement |
⏳ The session is unable to continue because it is waiting for a resource to become available.
🔎 pg_stat_activity allows us to quickly identify sessions that are waiting and determine whether the wait is caused by a lock, I/O operation, client communication, or another PostgreSQL activity.
🔍 9.6 Inspect Locks with pg_locks
The pg_locks system view displays lock information currently tracked by PostgreSQL. Every time a session acquires or waits for a lock, PostgreSQL records the details in this view.
Unlike pg_stat_activity, which shows what sessions are doing, pg_locks shows the locks those sessions hold or are waiting to acquire.
Key Columns
| Column | Description |
|---|---|
pid | PostgreSQL session ID |
locktype | Type of lock being tracked |
mode | Lock mode requested or granted |
granted | Whether the lock has been acquired |
Common Values
| Column | Example Value | Meaning |
|---|---|---|
🔐 locktype | relation | Lock on a table or index |
🔐 locktype | transactionid | Lock associated with a transaction |
🔐 locktype | tuple | Lock on an individual row |
📝 mode | RowExclusiveLock | Typical lock acquired by UPDATE |
📝 mode | AccessShareLock | Typical lock acquired by SELECT |
Common Lock Modes
| Lock Mode | Typical Operation |
|---|---|
| 📖 AccessShareLock | SELECT |
| ✏️ RowExclusiveLock | INSERT, UPDATE, DELETE |
| 🔒 ShareLock | Waiting for another transaction |
| 🔐 ExclusiveLock | Internal transaction coordination |
--Display transaction locks for Session A
SELECT
pid,
locktype,
transactionid,
mode,
granted
FROM pg_locks
WHERE locktype = 'transactionid';pid | locktype | transactionid | mode | granted
------+---------------+---------------+---------------+---------
6797 | transactionid | 794 | ExclusiveLock | t
6722 | transactionid | 793 | ExclusiveLock | t
6797 | transactionid | 793 | ShareLock | f
(3 rows)
Session Mapping
| Session | PID | Transaction ID |
|---|---|---|
| 🔐 Session A | 6722 | 793 |
| ⏳ Session B | 6797 | 794 |
Analyzing the Lock Information
| PID | Transaction ID | Mode | Granted | Interpretation |
|---|---|---|---|---|
| 6722 | 793 | ExclusiveLock | ✅ true | Session A owns transaction 793 |
| 6797 | 794 | ExclusiveLock | ✅ true | Session B owns transaction 794 |
| 6797 | 793 | ShareLock | ❌ false | Session B is waiting on Session A’s transaction |
What Is Happening?
| Step | Description |
|---|---|
| 1️⃣ | Session A (PID 6722) starts transaction 793 |
| 2️⃣ | Session A updates the row and keeps the transaction open |
| 3️⃣ | Session B (PID 6797) starts transaction 794 |
| 4️⃣ | Session B attempts to update the same row |
| 5️⃣ | PostgreSQL makes Session B wait on transaction 793 |
| 6️⃣ | Session B remains blocked until Session A commits or rolls back |
Key Observation
| Evidence | Meaning |
|---|---|
| 🔐 PID 6722 owns transaction 793 | Session A is the lock owner |
| ⏳ PID 6797 requests a ShareLock on transaction 793 | Session B is waiting |
❌ granted = false | The requested lock has not been granted |
💡 Session B already owns its own transaction (794), but it cannot continue because it is waiting for Session A’s transaction (793) to complete.
⛓️ 9.7 Blocking Chain Analysis
🎯 Goal
Identify the blocked session and the session causing the block.
🔎 pg_blocking_pids() is one of the fastest ways to identify which session is causing a lock wait.
Why This Is Useful
| Tool | Answers |
|---|---|
pg_stat_activity | Who is waiting? |
pg_locks | What lock is involved? |
pg_blocking_pids() | Who is causing the wait? |
--Display the blocking pid in Session A
SELECT
pid,
pg_blocking_pids(pid)
FROM pg_stat_activity;pid | pg_blocking_pids
------+------------------
5030 | {}
5031 | {}
6722 | {}
6401 | {}
6797 | {6722}
5027 | {}
Session Status
| PID | Blocking PID(s) | Status |
|---|---|---|
| 6722 | {} | 🔐 Blocking session |
| 6797 | {6722} | ⏳ Blocked session |
Understanding the Output
| Value | Meaning |
|---|---|
{} | Session is not blocked by anyone |
{6722} | Session is waiting for PID 6722 |
What Is Happening?
| Step | Description |
|---|---|
| 1️⃣ | Session A (PID 6722) updates the row |
| 2️⃣ | Session A keeps the transaction open |
| 3️⃣ | Session B (PID 6797) attempts to update the same row |
| 4️⃣ | PostgreSQL blocks Session B |
| 5️⃣ | pg_blocking_pids() identifies PID 6722 as the blocker |
Key Observation
| Evidence | Interpretation |
|---|---|
🔐 PID 6722 → {} | Not waiting on any session |
⏳ PID 6797 → {6722} | Waiting for Session A |
👀 Other PIDs → {} | Not involved in the blocking chain |
-- Issue commit in Session A.
commit; Now Observe the Session B, It advances to committed State.
💀 9.8 Deadlock Demo
🎯 Goal
A deadlock occurs when Session A holds one lock and waits for another lock held by Session B, while Session B waits for the first lock held by Session A.
Session A
--Session A: Lock the first row
BEGIN;
UPDATE consumer.customers
SET state = 'A'
WHERE customer_id = 100;Session B
-- Session B: Lock a different row
BEGIN;
UPDATE consumer.customers
SET state = 'B'
WHERE customer_id = 200;Session A
--Now Session A tries to update the row already locked by Session B.
UPDATE consumer.customers
SET state = 'A'
WHERE customer_id = 200;| Result | Meaning |
|---|---|
| ⏳ Waiting | Session A is now blocked by Session B |
Session B
--Now Session B tries to update the row already locked by Session A.
UPDATE consumer.customers
SET state = 'B'
WHERE customer_id = 100;creditcards=*# --Now Session B tries to update the row already locked by Session A.
UPDATE consumer.customers
SET state = 'B'
WHERE customer_id = 100;
ERROR: deadlock detected
DETAIL: Process 6797 waits for ShareLock on transaction 795; blocked by process 6722.
Process 6722 waits for ShareLock on transaction 796; blocked by process 6797.
HINT: See server log for query details.
CONTEXT: while updating tuple (16387,48) in relation "customers"
creditcards=!#
Observe
| Output | Meaning |
|---|---|
ERROR: deadlock detected | PostgreSQL found a circular lock wait |
| One transaction is cancelled | PostgreSQL breaks the deadlock automatically |
Summary
💀 A deadlock happens when two transactions block each other in a circle. PostgreSQL detects the problem and cancels one transaction so the system can continue.
Issue /q in both Session A and Session B – to exit and land in bash prompt
-- in both Session A and Session B.
\q🚨 9.9 Understanding Wait Events
🎯 Goal
Understand what PostgreSQL sessions are waiting for and how wait events help diagnose performance problems.
# Display wait event information for active sessions
psql -p 5432 -U postgres -d creditcards -c "
SELECT
pid,
wait_event_type,
wait_event
FROM pg_stat_activity;
"Understanding Wait Events
When a session cannot continue immediately, PostgreSQL records the reason in the wait_event_type and wait_event columns.
These columns help identify whether a session is waiting for a lock, disk access, client communication, or another resource.
Common Wait Event Types
| Wait Event Type | Meaning |
|---|---|
| 🔐 Lock | Waiting for a lock |
| 💾 IO | Waiting for disk I/O |
| 👤 Client | Waiting for client input |
| 📦 BufferPin | Waiting for access to a shared buffer |
| ⚙️ Activity | Waiting for background work |
🔎 The exact wait events visible on your system depend on the workload running at the time the query is executed.
⚡ 9.10 Resolve Blocking Sessions
🎯 Goal
Learn how to stop problematic queries and terminate sessions that are causing blocking issues.
Cancel a Running Query
Use pg_cancel_backend() to stop the currently running query while keeping the session connected.
# Cancel the currently running query -
psql -p 5432 -U postgres -d creditcards -c "
SELECT pg_cancel_backend(<pid>);
"Terminate a Session
Use pg_terminate_backend() to disconnect the entire session.
# Terminate a PostgreSQL session
psql -p 5432 -U postgres -d creditcards -c "
SELECT pg_terminate_backend(<pid>);
"Understanding the Functions
| Function | Action |
|---|---|
⚠️ pg_cancel_backend() | Cancel the currently executing query |
💥 pg_terminate_backend() | Terminate the entire session |
When to Use Each
| Situation | Recommended Action |
|---|---|
| Long-running query | ⚠️ pg_cancel_backend() |
| Blocking query | ⚠️ pg_cancel_backend() |
| Unresponsive session | 💥 pg_terminate_backend() |
| Session holding locks for too long | 💥 pg_terminate_backend() |
Key Takeaway
💡 Start with pg_cancel_backend() whenever possible. Use pg_terminate_backend() only when the session cannot be recovered or continues causing problems.
🔎 In production, first identify the blocking PID using pg_stat_activity or pg_blocking_pids(), then decide whether to cancel the query or terminate the session.
⚡ Chapter 10 – Buffer Cache and I/O Analysis
⚡ Chapter 10 – Buffer Cache and I/O Analysis
📌 Goal
Understand how PostgreSQL uses memory to avoid disk I/O and how cache warming affects query performance.
🎯 Learn
• ⚡ Shared Buffer Cache
• ⚡ Buffer Hits vs Disk Reads
• ⚡ pg_buffercache
• ⚡ pg_prewarm
• ⚡ Cold Cache vs Warm Cache
⚡ 10.1 Why Buffer Cache Matters
| Term | Meaning |
|---|---|
| 💾 Disk Read | Data read from storage |
| ⚡ Buffer Hit | Data already in memory |
| 🧠 Shared Buffers | PostgreSQL cache |
| 🚀 Warm Cache | Data already cached |
⚡ Memory access is dramatically faster than disk access. PostgreSQL therefore tries to keep frequently accessed data in shared buffers.
⚡ 10.2 Inspect Buffer Hit Ratios
# Display database buffer cache statistics
psql -p 5432 -U postgres -d creditcards -c "
SELECT
datname,
blks_read,
blks_hit,
ROUND(
100.0 * blks_hit /
NULLIF(blks_hit + blks_read,0),
2
) AS hit_ratio_pct
FROM pg_stat_database
WHERE datname='creditcards';
"datname | blks_read | blks_hit | hit_ratio_pct
-------------+-----------+----------+---------------
creditcards | 2924091 | 14394656 | 83.12
| Metric | Meaning |
|---|---|
| blks_read | Read from disk |
| blks_hit | Served from cache |
| hit_ratio_pct | Cache effectiveness |
⚡ 10.3 Cold Cache Demo ⭐
# Execute a full table scan
psql -p 5432 -U postgres -d creditcards -c "
EXPLAIN (ANALYZE, BUFFERS)
SELECT COUNT(*)
FROM consumer.transactions;
"Finalize Aggregate (cost=138728.59..138728.60 rows=1 width=8) (actual time=2954.071..2963.593 rows=1 loops=1)
Buffers: shared hit=30851 read=8896
-> Gather (cost=138728.37..138728.58 rows=2 width=8) (actual time=2953.195..2963.573 rows=3 loops=1)
Workers Planned: 2
Workers Launched: 2
Buffers: shared hit=30851 read=8896
-> Partial Aggregate (cost=137728.37..137728.38 rows=1 width=8) (actual time=2941.472..2941.474 rows=1 loops=3)
Buffers: shared hit=30851 read=8896
-> Parallel Index Only Scan using idx_transactions_merchant on transactions (cost=0.43..127326.34 rows=4160814 width=0) (actual time=0.512..
2012.465 rows=3333333 loops=3)
Heap Fetches: 0
Buffers: shared hit=30851 read=8896
Planning:
Buffers: shared hit=76 read=25
Planning Time: 5.355 ms
Execution Time: 2965.527 ms
(15 rows)
| Metric | Expected |
|---|---|
| shared read | High |
| Execution time | Higher |
💾 PostgreSQL must read many blocks from disk.
⚡ 10.4 Warm Cache Demo ⭐
# Execute the same query again
psql -p 5432 -U postgres -d creditcards -c "
EXPLAIN (ANALYZE, BUFFERS)
SELECT COUNT(*)
FROM consumer.transactions;
"Finalize Aggregate (cost=138728.59..138728.60 rows=1 width=8) (actual time=2163.070..2181.025 rows=1 loops=1)
Buffers: shared hit=39505
-> Gather (cost=138728.37..138728.58 rows=2 width=8) (actual time=2160.751..2181.004 rows=3 loops=1)
Workers Planned: 2
Workers Launched: 2
Buffers: shared hit=39505
-> Partial Aggregate (cost=137728.37..137728.38 rows=1 width=8) (actual time=2148.674..2148.676 rows=1 loops=3)
Buffers: shared hit=39505
-> Parallel Index Only Scan using idx_transactions_merchant on transactions (cost=0.43..127326.34 rows=4160814 width=0) (actual time=0.535..
1325.674 rows=3333333 loops=3)
Heap Fetches: 0
Buffers: shared hit=39505
Planning:
Buffers: shared hit=101
Planning Time: 1.165 ms
Execution Time: 2182.099 ms
(15 rows)
Observe:
| Metric | Expected |
|---|---|
| shared hit | High |
| shared read | Low (nil in our demo) |
| Execution time | Faster |
⚡ Most blocks are now served from memory instead of disk.
⚡ 10.5 Understanding BUFFERS Output
| Buffer Metric | Meaning |
|---|---|
| shared hit | Read from cache |
| shared read | Read from disk |
| shared dirtied | Modified page |
| shared written | Written to disk |
⚡ 10.6 Inspect Cached Pages with pg_buffercache
# Display objects currently stored in cache
psql -p 5432 -U postgres -d creditcards -c "
SELECT
c.relname,
COUNT(*) AS cached_buffers
FROM pg_buffercache b
JOIN pg_class c
ON b.relfilenode = pg_relation_filenode(c.oid)
GROUP BY c.relname
ORDER BY cached_buffers DESC
LIMIT 10;
"relname | cached_buffers
---------------------------------+----------------
idx_transactions_merchant | 8892
pg_attribute | 61
pg_class | 28
pg_attribute_relid_attnum_index | 16
pg_operator | 14
💡 pg_buffercache provides a snapshot of what is currently stored in PostgreSQL’s shared buffers. In this example, the idx_transactions_merchant index occupies most of the visible cache, indicating it has been accessed frequently and PostgreSQL considers it valuable to keep in memory.
⚡ 10.7 Warm Cache with pg_prewarm
When Should You Use pg_prewarm?pg_prewarm allows PostgreSQL to proactively load table or index pages into memory before queries access them.
| Good Candidates | Why |
|---|---|
| 🚀 Frequently accessed lookup tables | Used by almost every query |
| 🚀 Critical reference data | Must respond quickly after restart |
| 🚀 Frequently scanned indexes | Reduces initial disk reads |
| 🚀 Reporting tables used repeatedly | Improves startup performance |
🚀 pg_prewarm is most useful when specific tables or indexes must be available in memory immediately after startup. It is not a feature that should be applied indiscriminately to every object in the database.
🏁 10.8 Chapter Summary
| Topic | Tool |
|---|---|
| Buffer Statistics | pg_stat_database |
| Execution Plan Buffers | EXPLAIN BUFFERS |
| Cache Inspection | pg_buffercache |
| Cache Warming | pg_prewarm |
⚡ The difference between a slow query and a fast query is often not the SQL itself, but whether the required data is already cached in memory. Understanding buffer hits, disk reads, and cache warming is essential for diagnosing PostgreSQL performance.
🚀 Chapter 11 – Parallel Query Processing
🚀 Chapter 11 – Parallel Query Processing
📌 Goal
Understand how PostgreSQL uses multiple worker processes to execute large queries faster.
🚀 11.1 Chapter Introduction
Why Parallel Query Matters
| Concept | Description |
|---|---|
| 🧠 Serial Execution | One process executes the query |
| 🚀 Parallel Execution | Multiple workers share the work |
| ⚡ Faster Execution | Better CPU utilization |
| 📊 Large Queries Benefit Most | Especially scans and aggregates |
🚀 Parallel query processing allows PostgreSQL to divide work among multiple CPU cores.
🚀 11.2 Inspect Parallel Query Settings
Understand the parameters controlling parallel execution.
# Display parallel query settings
psql -p 5432 -U postgres -d creditcards -c "
SELECT name, setting, unit
FROM pg_settings
WHERE name IN (
'max_parallel_workers_per_gather',
'max_parallel_workers',
'min_parallel_table_scan_size'
);
"name | setting | unit
---------------------------------+---------+------
max_parallel_workers | 8 |
max_parallel_workers_per_gather | 2 |
min_parallel_table_scan_size | 1024 | 8kB
| Parameter | Purpose |
|---|---|
| max_parallel_workers_per_gather | Workers per query |
| max_parallel_workers | Total workers available |
| min_parallel_table_scan_size | Minimum table size for parallel scan |
🚀 11.3 Serial vs Parallel Execution ⭐
Step 1 — Serial Baseline
# Disable parallel execution and run a grouped aggregate
psql -p 5432 -U postgres -d creditcards -c "
SET max_parallel_workers_per_gather = 0;
EXPLAIN (ANALYZE, BUFFERS)
SELECT
merchant_name,
COUNT(*)
FROM consumer.transactions
GROUP BY merchant_name;
"GroupAggregate (cost=0.43..235557.51 rows=5001 width=21) (actual time=0.703..6173.024 rows=5000 loops=1)
Group Key: merchant_name
Buffers: shared hit=33891
-> Index Only Scan using idx_transactions_merchant on transactions (cost=0.43..185577.73 rows=9985953 width=13) (actual time=0.043..2880.203 rows=100000
00 loops=1)
Heap Fetches: 0
Buffers: shared hit=33891
Planning:
Buffers: shared hit=108
Planning Time: 0.582 ms
Execution Time: 6176.242 ms
(10 rows)
Step 2 — Enable Parallelism
# Enable parallel execution
psql -p 5432 -U postgres -d creditcards -c "
SET max_parallel_workers_per_gather = 4;
SET parallel_setup_cost = 0;
SET parallel_tuple_cost = 0;
EXPLAIN (ANALYZE, BUFFERS)
SELECT
merchant_name,
COUNT(*)
FROM consumer.transactions
GROUP BY merchant_name;
"Finalize GroupAggregate (cost=0.49..123647.87 rows=5001 width=21) (actual time=342.845..2783.268 rows=5000 loops=1)
Group Key: merchant_name
Buffers: shared hit=40490
-> Gather Merge (cost=0.49..123497.84 rows=20004 width=21) (actual time=342.736..2755.057 rows=12207 loops=1)
Workers Planned: 4
Workers Launched: 4
Buffers: shared hit=40490
-> Partial GroupAggregate (cost=0.43..123215.53 rows=5001 width=21) (actual time=2.125..2184.931 rows=2441 loops=5)
Group Key: merchant_name
Buffers: shared hit=40490
-> Parallel Index Only Scan using idx_transactions_merchant on transactions (cost=0.43..110683.08 rows=2496488 width=13) (actual time=0.312.
.1080.228 rows=2000000 loops=5)
Heap Fetches: 0
Buffers: shared hit=40490
Planning:
Buffers: shared hit=111
Planning Time: 2.011 ms
Execution Time: 2786.295 ms
(17 rows)
📊 PostgreSQL Scan Comparison Table
| Metric / Feature | Sequential Scan Plan | Parallel Scan Plan | Variance & Technical Impact |
| Total Execution Time | 6,176.24 ms (~6.18s) | 2,786.30 ms (~2.79s) | 54.9% Faster (~2.2x speedup via parallelism) |
| Planning Time | 0.582 ms | 2.011 ms | +245% Overhead (Planner must evaluate parallel paths) |
| Workers Active | 0 (Single-threaded) | 4 Workers + 1 Leader | 5 concurrent execution contexts utilized |
| Execution Strategy | Index Only Scan $\rightarrow$ GroupAggregate | Parallel Index Only Scan $\rightarrow$ Partial GroupAggregate $\rightarrow$ Gather Merge $\rightarrow$ Finalize GroupAggregate | Moves from single-stage to a two-stage distributed aggregation |
| Total Rows Processed | 10,000,000 (1 loop × 10M rows) | 10,000,000 (5 loops × 2M rows) | Identical data volume, but split into chunks per worker |
| Shared Buffer Hits | 33,891 | 40,490 | ~19.4% Increase (Parallel worker synchronization & page-sharing overhead) |
| Estimated Total Cost | 235,557.51 | 123,647.87 | ~47.5% Lower Cost (Costing is divided across workers) |
| Final Row Output | 5,000 rows | 5,000 rows | Identical query results |
⚡ Resource Boost: You get a much faster query response in parallel scan, but at the expense of higher background CPU utilization.
Key Takeaway
🚀 Parallel query processing allows PostgreSQL to use multiple CPU cores for a single query. Large scans and aggregations often benefit the most, but the planner only uses parallelism when the expected gain outweighs the coordination cost.
🧹 Chapter 12 – Vacuum, Autovacuum and Bloat Management
🧹 Chapter 12 – Vacuum, Autovacuum and Bloat Management
Understand how PostgreSQL reclaims storage.
• 🧹 Dead Tuples
• 🧹 VACUUM
• 🧹 AUTOVACUUM
• 🧹 Freeze Operations
• 📦 Table Bloat
• 📦 Index Bloatrevents table bloat, and maintains transaction visibility.
Refer to below from Chapter 2 onwards:
PostgreSQL Vacuum, Autovacuum and Bloat Management Deep Dive
Nice posts and useful content
thank you 🙂