
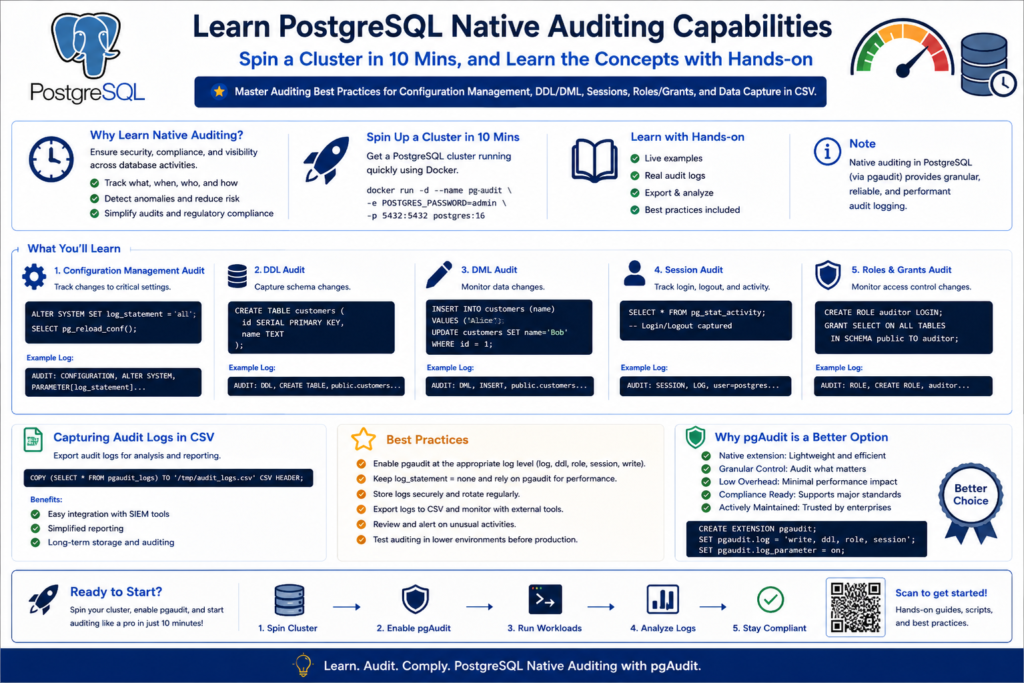
This page is designed for anyone who wants a practical and beginner-friendly path into PostgreSQL auditing — whether you are coming from an Oracle background or starting fresh with PostgreSQL.
You can spin up a PostgreSQL sandbox database cluster in just 10 minutes and follow along with the hands-on labs to learn native auditing step by step.
If you don’t already have an environment ready, please follow the Sandbox preparation steps before starting the labs.
Note: This tutorial series is fully hands-on and focused on learning by doing.
Disclaimer: This guide is provided for educational purposes only and is not intended for production use. These steps were documented and tested in a controlled sandbox environment. Please exercise caution before applying any changes to a production system; the author assumes no responsibility for discrepancies or issues. Use at your own risk.
Designing a Modular PostgreSQL Logging Architecture
Designing a Modular PostgreSQL Logging Architecture
Instead of managing one giant config file or using ALTER SYSTEM, we use a conf.d/ directory for better administration:
- Organized Sections: Separate files for Extensions, Logging, and Auditing make it easy to find and update specific settings.
- Clear Source of Truth: We avoid
ALTER SYSTEMbecause it writes to a file (postgresql.auto.conf) that overrides our manual changes and causes confusion. - Easy Maintenance: You can swap or update individual modules (like an audit policy) without touching the core database configuration.
- Faster Troubleshooting: If a setting is wrong, you only have to check a small, 10-line file rather than a 500-line document.
# check the config file name
psql --port=5432 --username=postgres -c "SHOW config_file;"In the Below section, we backup the original file , create a directory , append the main conf file to include the directory path , and verify the update of the config file.
# Update the config file to include directories
# 1. Copy the postgresql.conf
cp /var/lib/pgsql/onboarding/postgresql.conf /var/lib/pgsql/onboarding/postgresql.conf.bak_$(date +%Y%m%d)

# 2. Create the Configuration Directory
mkdir -p /var/lib/pgsql/onboarding/conf.d

# 3. Append the include_dir Statement
echo "include_dir = '/var/lib/pgsql/onboarding/conf.d'" >> /var/lib/pgsql/onboarding/postgresql.conf

# 4. Verify the Change
tail -n 1 /var/lib/pgsql/onboarding/postgresql.conf# Add README.txt file for reading / how to use - purpose.
cat >> /var/lib/pgsql/onboarding/conf.d/README.txt <<'EOF'
Add new parameters to the appropriate file based on their purpose.
Avoid using ALTER SYSTEM to keep configuration management clean and centralized.
PostgreSQL Modular Configuration Directory
------------------------------------------
00-extensions.conf : Used for PostgreSQL extension-related parameters.
01-logging.conf : Used for logging settings such as CSV logging, rotation.
02-auditing.conf : Used for audit-related configuration parameters.
EOF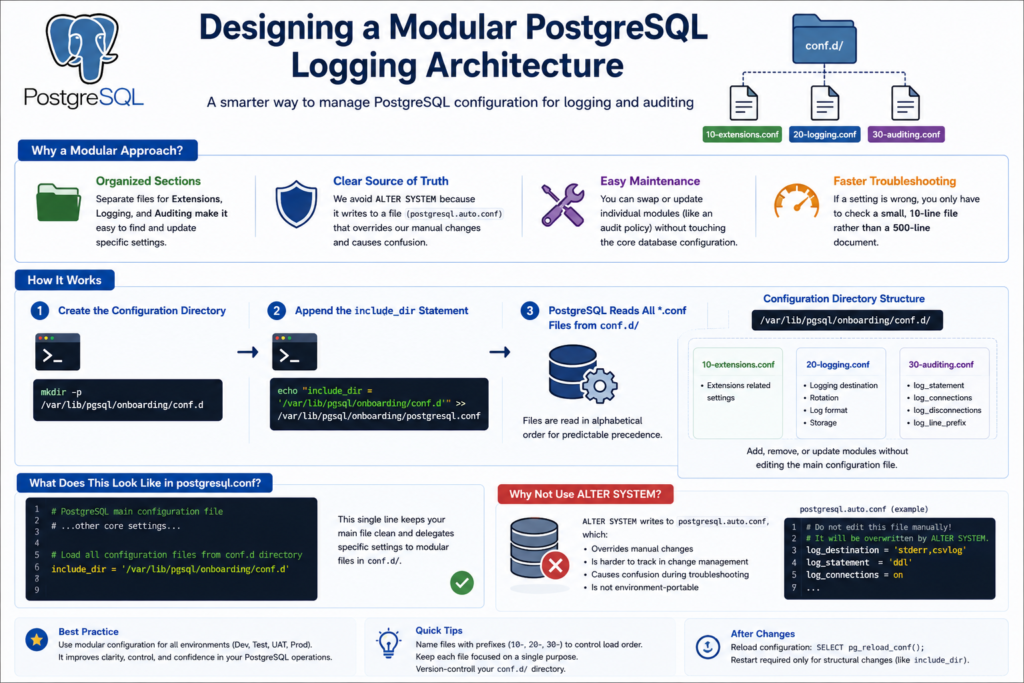
Building a Structured Logging Foundation with CSVLOG
Building a Structured Logging Foundation with CSVLOG
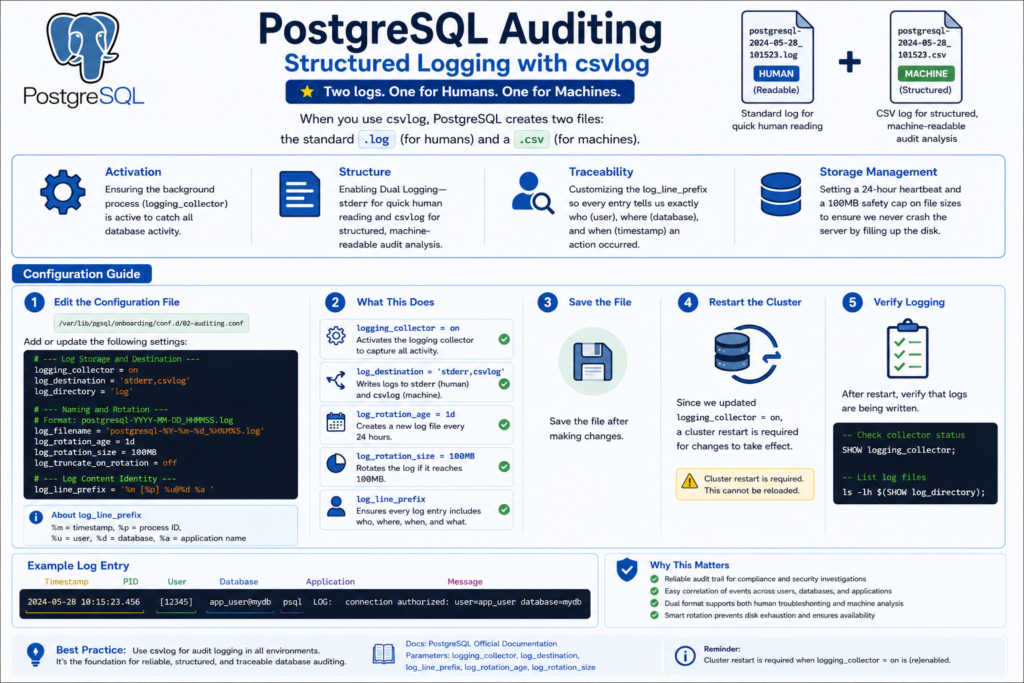
When you use stderr,csvlog - PostgreSQL creates two files: the standard .log (for humans) and a .csv (for machines).
Please read the official docs: https://www.postgresql.org/docs/current/runtime-config-logging.html
- Structured Data: Every log entry has a fixed number of columns (timestamp, user, PID, etc.).
- Queryable: You can create a “Foreign Table” in Postgres and query your logs using standard SQL.
- Compliance: Auditors love CSVs because they are easily imported into spreadsheets or log management tools.
Before we run the commands, here is a summary of the Logging Infrastructure we are building. We are moving from a basic, silent setup to a structured, DBA-ready environment:
- Activation: Ensuring the background process (
logging_collector) is active to catch all database activity. - Structure: Enabling Dual Logging—
stderrfor quick human reading andcsvlogfor structured, machine-readable audit analysis. - Traceability: Customizing the
log_line_prefixso every entry tells us exactly who (user), where (database), and when (timestamp) an action occurred. - Storage Management: Setting a log_rotation_age – 24-hour heartbeat and a log_rotation_size – 100MB safety cap on file sizes to ensure we never crash the server by filling up the disk.
- Audit Persistence: Using a unique timestamp-based naming convention to ensure our audit history is never overwritten and remains organized chronologically.
Check the alert log for the database:
# Check for the Alert log of the database
psql --port=5432 --username=postgres -c "SELECT current_setting('data_directory') || '/' || current_setting('log_directory') || '/' || name AS full_path FROM pg_ls_logdir() ORDER BY modification DESC LIMIT 1;"Pre-Modification Audit Check
# Check the current value of settings
psql --port=5432 --username=postgres -c "SELECT name, setting, short_desc FROM pg_settings WHERE name LIKE 'log_%' AND context != 'internal' ORDER BY name;"# Create an empty extension files for now, we will revisit this later.
cat <<EOF > /var/lib/pgsql/onboarding/conf.d/00-extensions.conf
# Shared libraries to load (Requires Restart)
shared_preload_libraries = ''
EOFcat <<EOF > /var/lib/pgsql/onboarding/conf.d/01-logging.conf
# --- Log Storage and Destination ---
logging_collector = on
log_destination = 'stderr,csvlog'
log_directory = 'log'
# --- Naming and Rotation ---
# Format: postgresql-YYYY-MM-DD_HHMMSS.log
log_filename = 'postgresql-%Y-%m-%d_%H%M%S.log'
log_rotation_age = 1d
log_rotation_size = 100MB
log_truncate_on_rotation = off
# --- Log Content Identity ---
log_line_prefix = '%m [%p] %u@%d %a '
EOFSince we updated logging_collector = on, the cluster restart is required .
# Restart the cluster
/usr/pgsql-16/bin/pg_ctl restart -D /var/lib/pgsql/onboardingExecute the command below to verify which configuration parameters are being fetched from specific config files
psql --port=5432 --username=postgres -c "SELECT name, setting, sourcefile, sourceline FROM pg_settings WHERE name LIKE 'log_%' AND sourcefile IS NOT NULL;"Post restart, check if both the log and csv files are being written
psql --port=5432 --username=postgres -c "SELECT * FROM pg_ls_logdir() ORDER BY modification DESC LIMIT 5;"example: – replace with your csv file to see the sample contents
head -n 2 /var/lib/pgsql/onboarding/log/postgresql-2026-05-04_201332.csv
Connection and Session Auditing in PostgreSQL
Connection and Session Auditing in PostgreSQL
This is the “Who and When” of your database. It’s essential for tracking access patterns and ensuring that connections are being closed properly.
- Identifies who accessed the database, when the session started, and how the connection ended.
- Helps DBAs detect unauthorized access attempts and monitor application connection behavior.
- Provides critical audit evidence for troubleshooting, compliance reviews, and security investigations.
# 1. Enable tracking of logins and logouts
cat <<EOF > /var/lib/pgsql/onboarding/conf.d/02-auditing.conf
# Connection auditing
log_connections = on
log_disconnections = on
EOF

# 2. Reload the configuration
psql --port=5432 --username=postgres -c "SELECT pg_reload_conf();"# Check for the Alert log of the database
psql --port=5432 --username=postgres -c "SELECT current_setting('data_directory') || '/' || current_setting('log_directory') || '/' || name AS full_path FROM pg_ls_logdir() ORDER BY modification DESC LIMIT 1;"Open a new terminal and log in.
Then check your log: tail -f <Alertlog_file_from_above>
You will see entries like: connection authorized: user=postgres database=postgres and disconnection: session time: 0:00:05.123.
#Visualization : which parameter is fetched from which config file along wth line nmrb
psql --port=5432 --username=postgres -c "SELECT name, setting, sourcefile, sourceline FROM pg_settings WHERE sourcefile IS NOT NULL ORDER BY sourcefile, sourceline;"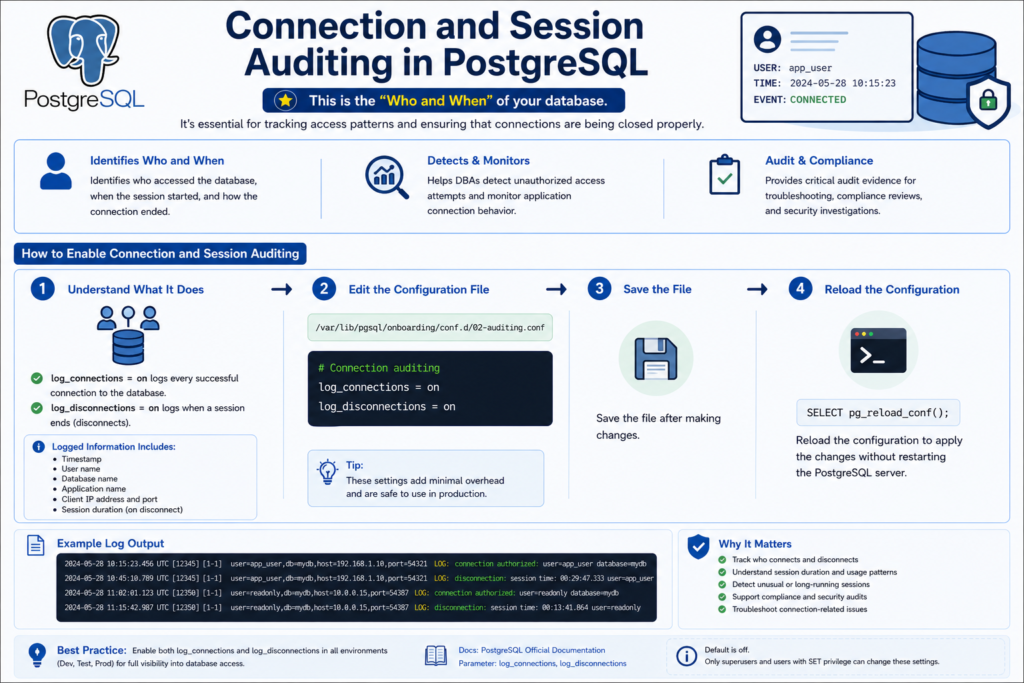
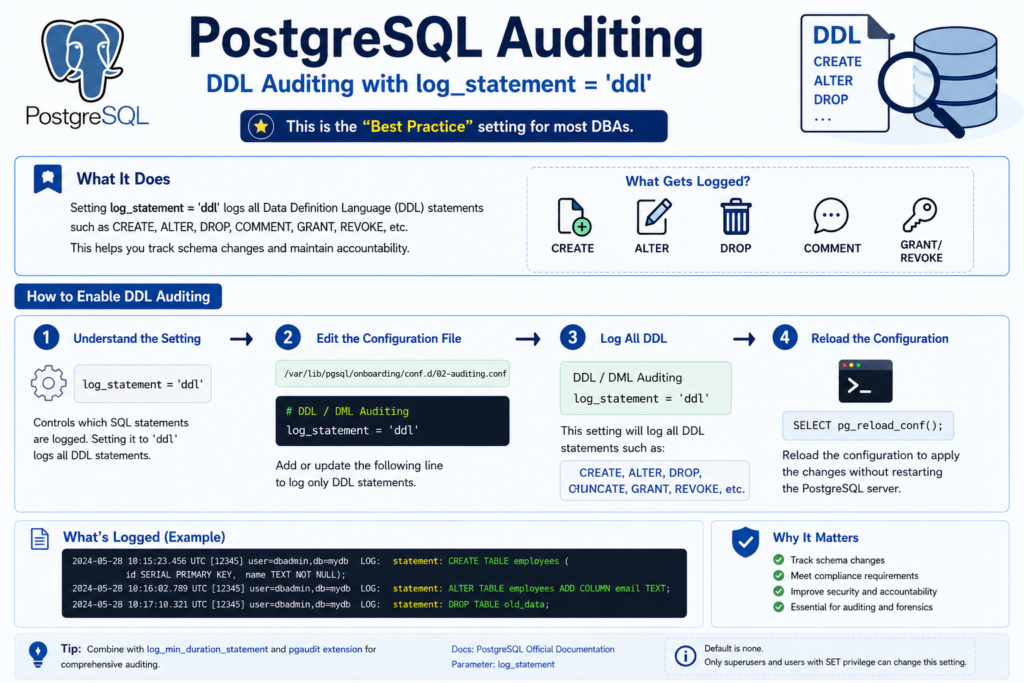
DDL Auditing with log_statement = 'ddl'
DDL Auditing with log_statement = 'ddl'
In a production environment, you usually don’t care about every SELECT, but you always care if someone changes a table structure. This is the “Best Practice” setting for most DBAs.
from official links: LOG-STATEMENT

# 3. Log all DDL (CREATE, ALTER, DROP, etc.)
cat <<'EOF' >> /var/lib/pgsql/onboarding/conf.d/02-auditing.conf
# DDL / DML Auditing
log_statement = 'ddl'
EOF

# 4. Reload the configuration
psql --port=5432 --username=postgres -c "SELECT pg_reload_conf();"Keep the logfile in tail in other session – see whats all being recorded in the log.
tail -f /var/lib/pgsql/onboarding/log/postgresql-2026-05-05_000000.log
# 1. create a database called business lending
psql --port=5432 --username=postgres -c "CREATE DATABASE business_lending;"

# 2. create a schema called kyc inside the business lending database
psql --port=5432 --username=postgres -d business_lending -c "CREATE SCHEMA kyc;"

# 3. create a sample table in the schema - kyc
psql --port=5432 --username=postgres -d business_lending -c "CREATE TABLE kyc.applications (application_id int, applicant_name text, status text);"

# 4. Add a new column to the table
psql --port=5432 --username=postgres -d business_lending -c "ALTER TABLE kyc.applications ADD COLUMN created_at timestamp;"

# 5. Drop an existing column from the table
psql --port=5432 --username=postgres -d business_lending -c "ALTER TABLE kyc.applications DROP COLUMN status;"

# 6. Grant SELECT privilege on the table to PUBLIC
psql --port=5432 --username=postgres -d business_lending -c "GRANT SELECT ON TABLE kyc.applications TO PUBLIC;"

# 7. Revoke SELECT privilege from PUBLIC on the table
psql --port=5432 --username=postgres -d business_lending -c "REVOKE SELECT ON TABLE kyc.applications FROM PUBLIC;"

# 8. Add a comment to the table
psql --port=5432 --username=postgres -d business_lending -c "COMMENT ON TABLE kyc.applications IS 'KYC loan application master table';"Check your log—tail -f tail -f /var/lib/pgsql/onboarding/log/postgresql-2026-05-05_000000.log
you will see the statements are Audited in the LOGFILE.
DML Auditing with log_statement = ‘mod’
DML Auditing with log_statement = ‘mod’
Note: log_statement = 'ddl‘ captures schema-level operations such as CREATE, ALTER, DROP, GRANT, REVOKE, and COMMENT, but does not capture TRUNCATE .
To Check which parameter resides in which config file, execute below query
# Execute below command to know which config file to edit - for log_statement
psql --port=5432 --username=postgres -c "
SELECT
    name,
    setting,
    sourcefile,
    sourceline
FROM pg_settings
WHERE name in ('log_statement')
  AND sourcefile IS NOT NULL
ORDER BY sourcefile, sourceline;"Audit for DML – by Replacing ddl with mod
# Replace ddl with mod
sed -i "s/^log_statement[[:space:]]*=[[:space:]]*'ddl'/log_statement = 'mod'/" \
/var/lib/pgsql/onboarding/conf.d/02-auditing.conf# reload PostgreSQL configuration:
psql --port=5432 --username=postgres -c "SELECT pg_reload_conf();"# Verify the changes.
psql --port=5432 --username=postgres -c "
SELECT
name,
setting,
sourcefile,
sourceline
FROM pg_settings
WHERE name in ('log_statement')
AND sourcefile IS NOT NULL
ORDER BY sourcefile, sourceline;"Keep the logfile in tail in other session – see whats all being recorded in the log.
tail -f /var/lib/pgsql/onboarding/log/postgresql-2026-05-05_000000.log
Lets initiate some DML operations (also Truncate action)
# 1. Insert sample rows into the table
psql --port=5432 --username=postgres -d business_lending -c "INSERT INTO kyc.applications (application_id, applicant_name, created_at) VALUES (1, 'John Doe', now());"


# 2. Update an existing row
psql --port=5432 --username=postgres -d business_lending -c "UPDATE kyc.applications SET applicant_name = 'John Smith' WHERE application_id = 1;"

# 3. Delete a row
psql --port=5432 --username=postgres -d business_lending -c "DELETE FROM kyc.applications WHERE application_id = 1;"

# 4. Truncate the table
psql --port=5432 --username=postgres -d business_lending -c "TRUNCATE TABLE kyc.applications;"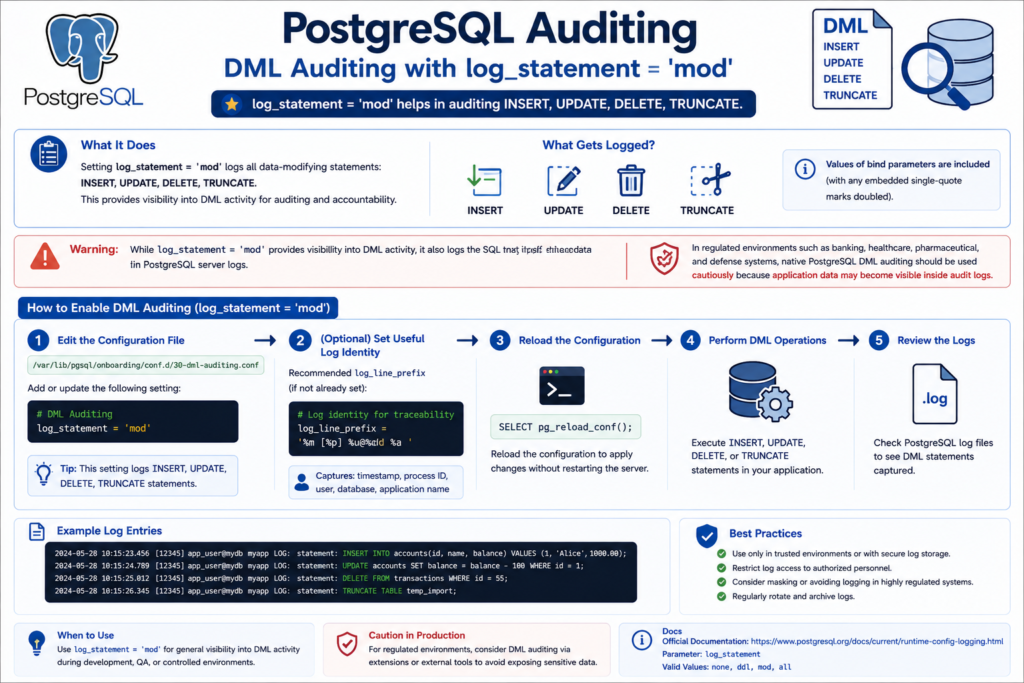
Capturing Failed SQL Statements and Security Events
Capturing Failed SQL Statements and Security Events
- Successful operations show activity, but failed operations often reveal security risks, application defects, privilege violations, and operational issues.
- PostgreSQL maintains a separate internal error reporting subsystem that logs failed operations, authentication issues, server events, and SQL execution errors independently of
log_statementauditing. - By default, PostgreSQL automatically captures SQL statements associated with
ERROR,FATAL, andPANICconditions through thelog_min_error_statementparameter, even when statement auditing is not explicitly enabled.
Keep the logfile open- tail in other session – see whats all being recorded in the log.
tail -f /var/lib/pgsql/onboarding/log/postgresql-2026-05-05_000000.log
# Simulate Permission Denied Error
# Create a readonly user
psql --port=5432 --username=postgres -c "CREATE ROLE audit_readonly LOGIN PASSWORD 'Secret123';"

# Grant only CONNECT privilege
psql --port=5432 --username=postgres -d business_lending -c "GRANT CONNECT ON DATABASE business_lending TO audit_readonly;"

# Attempt unauthorized INSERT
psql --port=5432 --username=audit_readonly -d business_lending -c "INSERT INTO kyc.applications VALUES (101, 'John Doe', now());"# Object Not Found Error
psql --port=5432 --username=postgres -d business_lending -c "SELECT * FROM kyc.non_existing_table;"# Syntax Error
psql --port=5432 --username=postgres -d business_lending -c "SELEC * FROM kyc.applications;"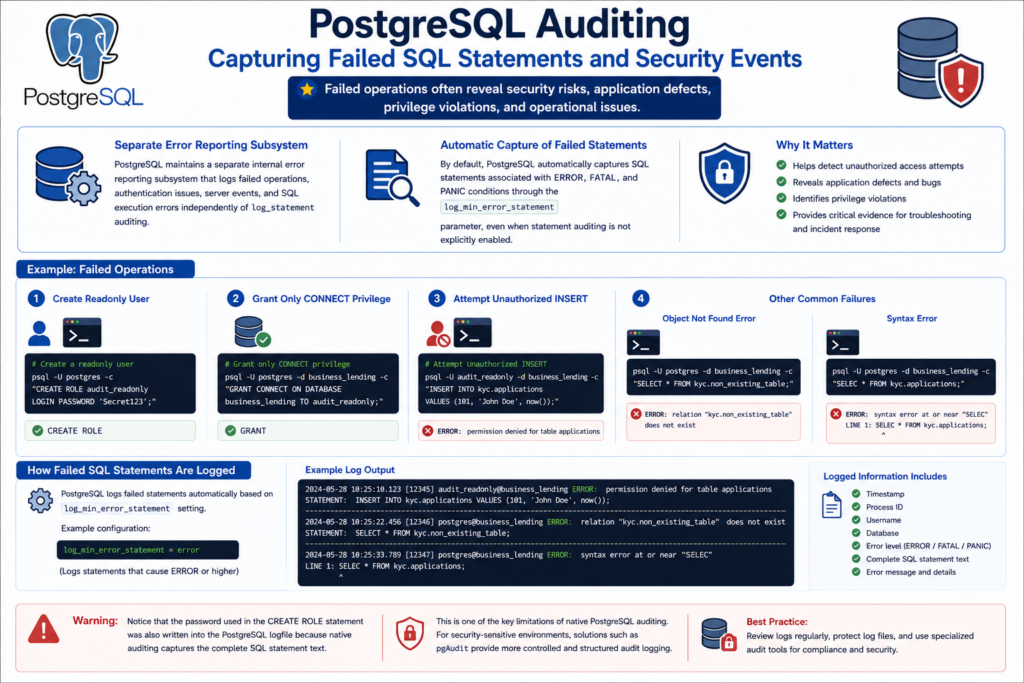
Auditing Slow Queries and Statement Duration
Auditing Slow Queries and Statement Duration
PostgreSQL can natively audit slow-running SQL statements and query execution duration using built-in logging parameters. Slow query auditing helps identify:
- slow queries
- inefficient SQL
- blocking operations
- application performance issues
Unlike statement auditing, duration auditing focuses on performance visibility rather than security or governance. Slow query auditing is extremely useful for identifying operational bottlenecks and abnormal workload patterns in production systems.
Keep the logfile open- tail in other session – see whats all being recorded in the log.
tail -f /var/lib/pgsql/onboarding/log/postgresql-2026-05-05_000000.log
# Configure slow query auditing
cat <<'EOF' >> /var/lib/pgsql/onboarding/conf.d/02-auditing.conf

# Slow Query and Duration Auditing
log_min_duration_statement = 500ms

EOF# Reload the Configuration
psql --port=5432 --username=postgres -c "SELECT pg_reload_conf();"# Validate the Configuration
psql --port=5432 --username=postgres -c "
SELECT
name,
setting,
sourcefile
FROM pg_settings
WHERE name = 'log_min_duration_statement';"Demonstration
# 1 Simulating a Slow Query
psql --port=5432 --username=postgres -d business_lending -c "SELECT pg_sleep(1);"# 2 Fast Query Not Logged
psql --port=5432 --username=postgres -d business_lending -c "SELECT 1;"# 3 Simulating a Heavy Query
psql --port=5432 --username=postgres -d business_lending -c "
SELECT count(*) FROM generate_series(1,10000000);"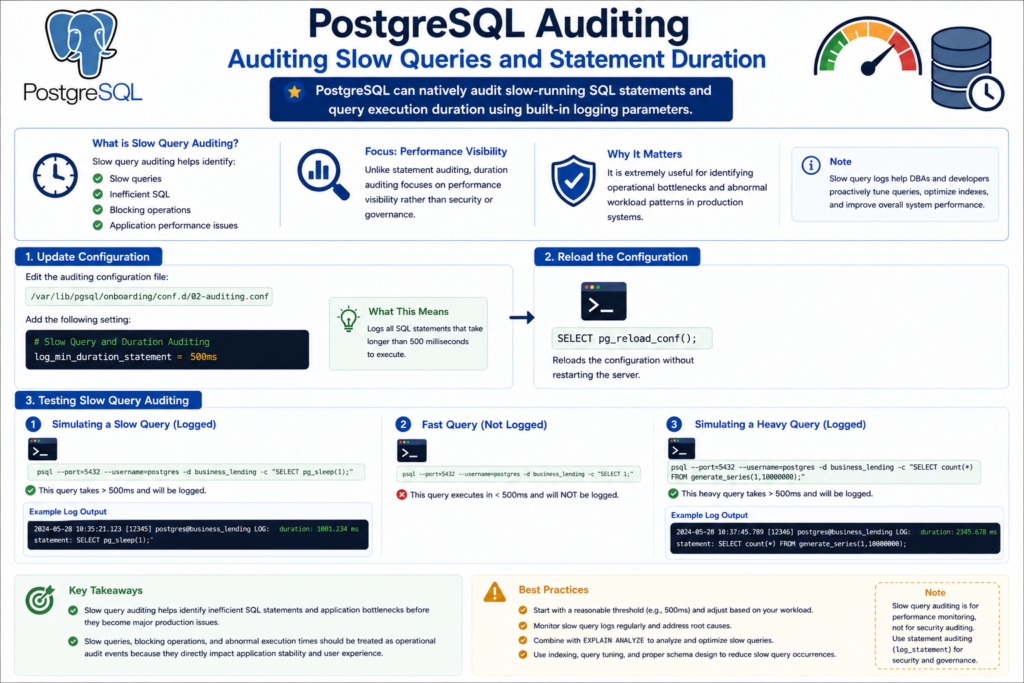
Auditing Lock, Wait and Deadlock
Auditing Lock, Wait and Deadlock
PostgreSQL can natively audit blocking sessions, lock waits, and deadlock events using built-in logging parameters.
This helps identify:
- blocking transactions
- long wait events
- deadlocks
- application concurrency issues
# Configure lock and deadlock auditing
cat <<'EOF' >> /var/lib/pgsql/onboarding/conf.d/02-auditing.conf

# Lock, Wait, and Deadlock Auditing
log_lock_waits = on
deadlock_timeout = '1s'

EOF# Reload the Configuration
psql --port=5432 --username=postgres -c "SELECT pg_reload_conf();"# Validate the Configuration
psql --port=5432 --username=postgres -c "
SELECT
name,
setting,
sourcefile
FROM pg_settings
WHERE name IN ('log_lock_waits', 'deadlock_timeout');
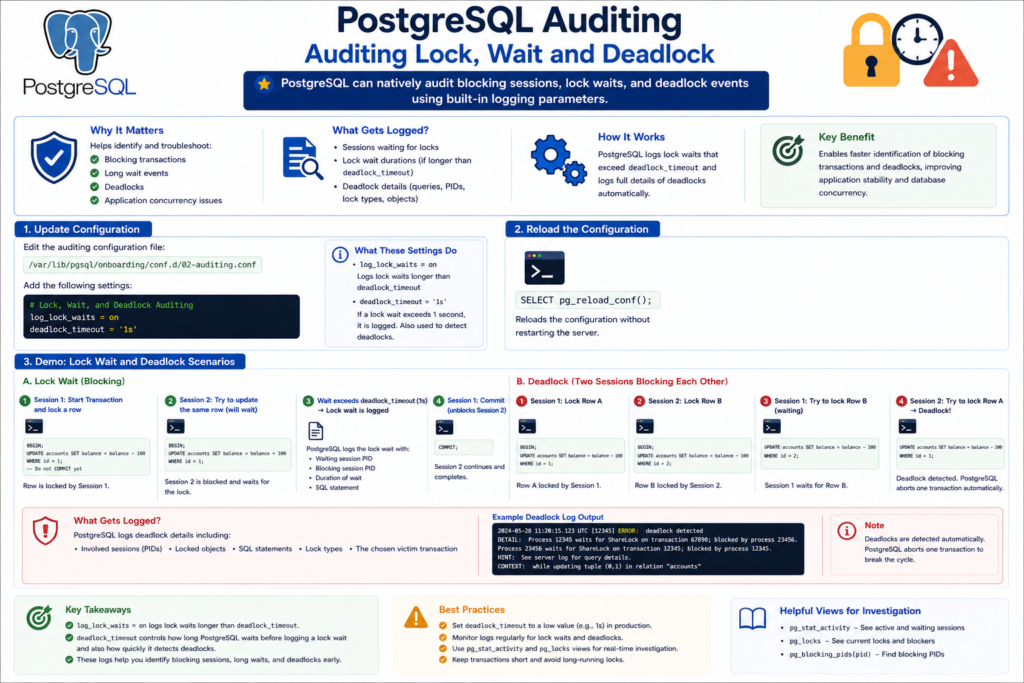
"In this Tutorials, we will have 3 terminals open .
- Terminal 1 — Simulate the first database session and hold locks or transactions open.
- Terminal 2 — Simulate the second database session to create blocking, wait events, or deadlock scenarios.
- Terminal 3 — Continuously monitor the PostgreSQL logfile and capture the generated audit entries in real time. example: tail -f /var/lib/pgsql/onboarding/log/postgresql-2026-05-05_000000.log
Demonstration 1 — Simulating a Blocking Session
Terminal 1
# login to the psql promp
psql --port=5432 --username=postgres -d business_lendingBEGIN;
UPDATE kyc.applications
SET applicant_name = 'BLOCKING_SESSION'
WHERE application_id = 1;Note: Do not issue commit in Terminal 1.
Terminal 2
# login to the psql promp
psql --port=5432 --username=postgres -d business_lendingUPDATE kyc.applications
SET applicant_name = 'WAITING_SESSION'
WHERE application_id = 1;Terminal 3
Demonstration 2 — Identifying Blocking Sessions
# Check for Blocking session
psql --port=5432 --username=postgres -d business_lending -c "
SELECT
    pid,
    usename,
    state,
    wait_event_type,
    wait_event,
    query
FROM pg_stat_activity
WHERE wait_event_type = 'Lock';
"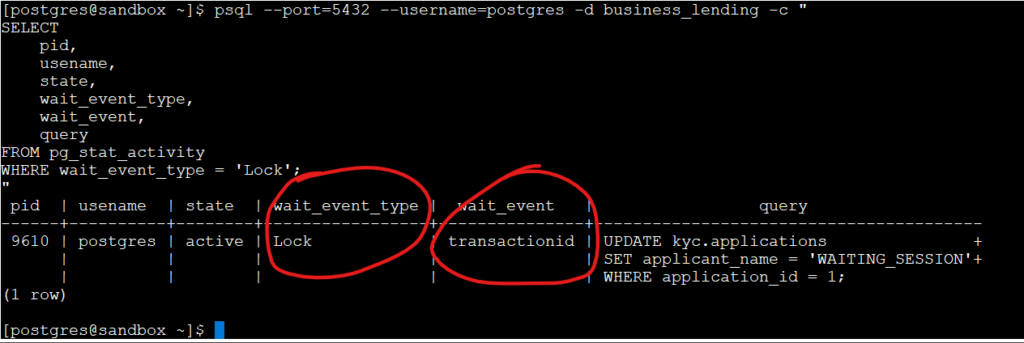
This session now waits for the row lock. After 1 second, PostgreSQL logs:
tail -f /var/lib/pgsql/onboarding/log/postgresql-2026-05-05_000000.logIn the Current Active Logfile, check for the “process 9610 acquired ShareLock on transaction“
Terminal 1
-- in psql prompt
commit;Demonstration 3 — Simulating a Deadlock
Terminal 1
BEGIN;

UPDATE kyc.applications
SET applicant_name = 'SESSION1'
WHERE application_id = 1;Terminal 2
BEGIN;

UPDATE kyc.applications
SET applicant_name = 'SESSION2'
WHERE application_id = 2;Terminal 1
UPDATE kyc.applications
SET applicant_name = 'SESSION1_WAIT'
WHERE application_id = 2;Terminal 2
UPDATE kyc.applications
SET applicant_name = 'SESSION2_WAIT'
WHERE application_id = 1;PostgreSQL detects deadlock.
Now issue : Commit in both Terminal 1 and Terminal 2- in psql prompte
PostgreSQL logged the lock wait after one second because log_lock_waits was enabled and deadlock_timeout was set to 1s, which makes blocking sessions visible before they turn into bigger performance problems.
Demonstration 4 — Auditing Long Wait Events
Terminal 1 — Hold Exclusive Lock
BEGIN;

LOCK TABLE kyc.applications IN ACCESS EXCLUSIVE MODE;This acquires the strongest table lock and blocks:
- SELECT
- INSERT
- UPDATE
- DELETE
against the table.
Do NOT commit.
Terminal 2 — Simulate Waiting Query
SELECT * FROM kyc.applications;This query now hangs/waits because:
ACCESS EXCLUSIVE
blocks:ACCESS SHARE
required by SELECT.
Terminal 3 — Monitor Wait Events
psql --port=5432 --username=postgres -d business_lending -c "
SELECT
    pid,
    usename,
    state,
    wait_event_type,
    wait_event,
    query
FROM pg_stat_activity
WHERE wait_event_type = 'Lock';
"
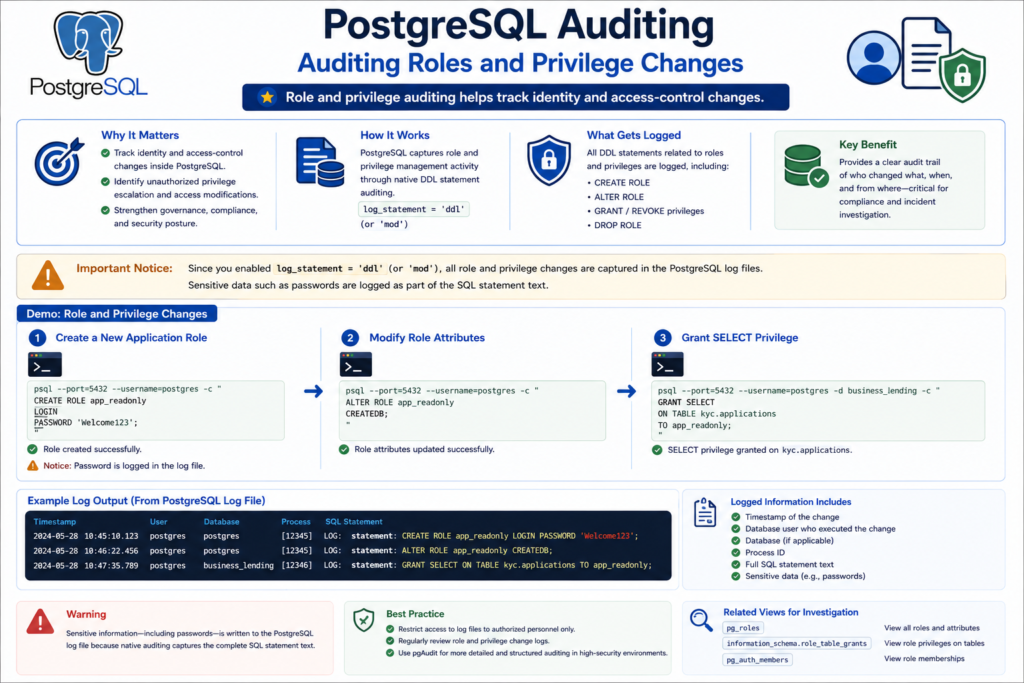
Auditing Roles and Privilege Changes
Auditing Roles and Privilege Changes
Since you already enabled: log_statement = ‘ddl‘ (or – mod)
PostgreSQL role and privilege changes are captured through DDL auditing.
Intro Points
- Role and privilege auditing helps track identity and access-control changes inside PostgreSQL.
- Governance-focused auditing is critical for identifying unauthorized privilege escalation and access modifications.
- PostgreSQL captures role and privilege management activity through native DDL statement auditing.
Keep the logfile open- tail in other session – see whats all being recorded in the log.
tail -f /var/lib/pgsql/onboarding/log/postgresql-2026-05-05_000000.log
Demonstration 1 — CREATE ROLE Auditing
# Create a new application role
psql --port=5432 --username=postgres -c "
CREATE ROLE app_readonly
LOGIN
PASSWORD 'Welcome123';
"Important Security Observation
- Notice that the password is visible in the PostgreSQL logfile because native statement auditing captures the complete SQL statement text.
Demonstration 2 — ALTER ROLE Auditing
# Modify role attributes
psql --port=5432 --username=postgres -c "
ALTER ROLE app_readonly
CREATEDB;
"Expected Logfile Entry
LOG: statement: ALTER ROLE app_readonly CREATEDB;Demonstration 3 — GRANT Privilege Auditing
# Grant SELECT privilege
psql --port=5432 --username=postgres -d business_lending -c "
GRANT SELECT
ON TABLE kyc.applications
TO app_readonly;
"Expected Logfile Entry
LOG: statement: GRANT SELECT ON TABLE kyc.applications TO app_readonly;Demonstration 4 — REVOKE Privilege Auditing
# Revoke SELECT privilege
psql --port=5432 --username=postgres -d business_lending -c "
REVOKE SELECT
ON TABLE kyc.applications
FROM app_readonly;
"Demonstration 5 — Failed Privilege Escalation
# Attempt superuser operation as readonly user
psql --host=127.0.0.1 \
--port=5432 \
--username=app_readonly \
-d business_lending \
-c "CREATE ROLE hacker SUPERUSER;"Expected Logfile
ERROR: permission denied to create role
STATEMENT: CREATE ROLE hacker SUPERUSER;
Key Takeaways
- Role and privilege auditing helps track identity and access-control changes in PostgreSQL environments.
- Governance auditing is critical for identifying unauthorized privilege escalation and security policy violations.
- PostgreSQL captures role-management activity through native DDL auditing using
log_statement = 'ddl'. - Native statement auditing may expose sensitive information such as passwords in PostgreSQL logfiles.
- Role and privilege changes should be treated as high-value audit events in enterprise environments.
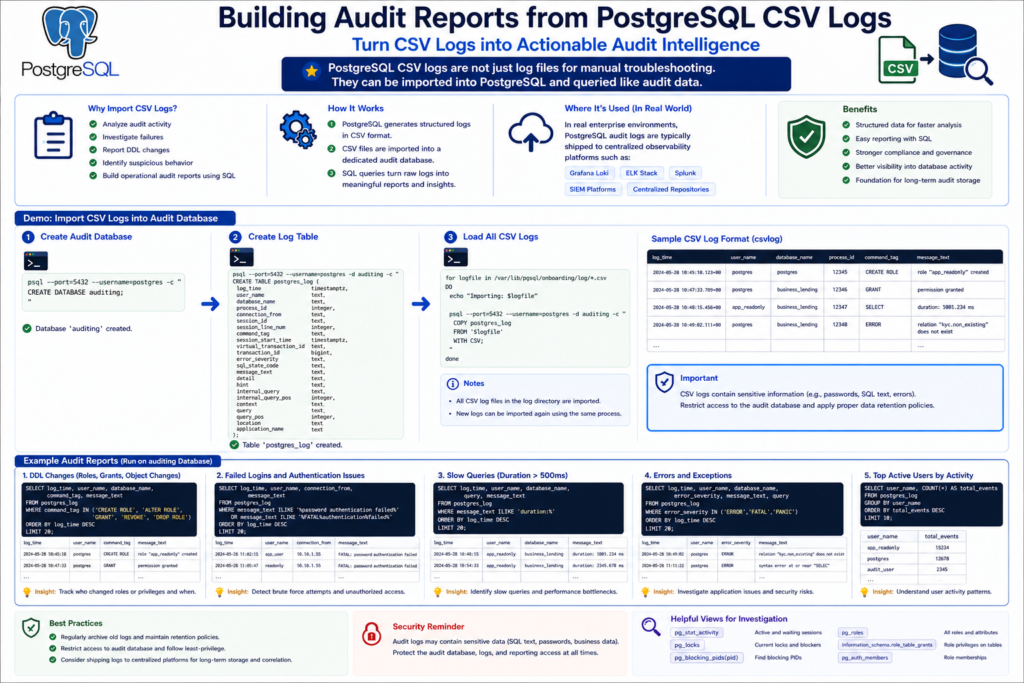
Building Audit Reports from PostgreSQL CSV Logs
Building Audit Reports from PostgreSQL CSV Logs
PostgreSQL CSV logs are not just log files for manual troubleshooting.
They can also be imported into PostgreSQL and queried like audit data.
This makes it easier to:
- analyze audit activity
- investigate failures
- report DDL changes
- identify suspicious behavior
- build operational audit reports using SQL
Since CSV logging was already enabled earlier in the series, PostgreSQL is continuously generating structured audit records in CSV format.
Creating a Dedicated Audit Reporting Database
For demonstration purposes, the PostgreSQL CSV audit logs will be imported into a separate database named auditing.
In real enterprise environments, PostgreSQL audit logs are typically shipped to centralized observability platforms such as:
- Grafana Loki
- ELK Stack
- Splunk
- SIEM platforms
- centralized audit repositories
However, for this self-contained demonstration, the audit reporting setup is intentionally created within the same PostgreSQL cluster to simplify testing and analysis.
Create Dedicated Auditing Database
psql --port=5432 --username=postgres -c "
CREATE DATABASE auditing;
"Create Audit Staging Table
psql --port=5432 --username=postgres -d auditing -c "
CREATE TABLE postgres_log
(
    log_time                timestamp(3) with time zone,
    user_name               text,
    database_name           text,
    process_id              integer,
    connection_from         text,
    session_id              text,
    session_line_num        bigint,
    command_tag             text,
    session_start_time      timestamp with time zone,
    virtual_transaction_id  text,
    transaction_id          bigint,
    error_severity          text,
    sql_state_code          text,
    message                 text,
    detail                  text,
    hint                    text,
    internal_query          text,
    internal_query_pos      integer,
    context                 text,
    query                   text,
    query_pos               integer,
    location                text,
    application_name        text,
    backend_type            text,
    leader_pid              integer,
    query_id                bigint,
    PRIMARY KEY (session_id, session_line_num)
);
"Import CSV Audit Logs
for logfile in /var/lib/pgsql/onboarding/log/*.csv
do
    echo "Importing: $logfile"

    psql --port=5432 --username=postgres -d auditing -c "
    COPY postgres_log
    FROM '$logfile'
    WITH CSV;
    "
doneRead all ERROR, FATAL, and PANIC events
# 1. Read all ERROR, FATAL, and PANIC events
psql --port=5432 --username=postgres -d auditing -c "
SELECT
    log_time,
    user_name,
    database_name,
    error_severity,
    message,
    query
FROM postgres_log
WHERE error_severity IN ('ERROR', 'FATAL', 'PANIC')
ORDER BY log_time DESC;
"Count errors grouped by severity
# 2. Count errors grouped by severity
psql --port=5432 --username=postgres -d auditing -c "
SELECT
    error_severity,
    count(*) AS total
FROM postgres_log
WHERE error_severity IN ('ERROR', 'FATAL', 'PANIC')
GROUP BY error_severity
ORDER BY total DESC;
"Report failed login attempts
# 3. Report failed login attempts
psql --port=5432 --username=postgres -d auditing -c "
SELECT
    log_time,
    user_name,
    database_name,
    message
FROM postgres_log
WHERE message ILIKE '%password authentication failed%'
   OR message ILIKE '%authentication failed%'
ORDER BY log_time DESC;
"Note: Failed password login attempts could not be demonstrated in this lab because local PostgreSQL connections were using peer authentication, which bypasses password validation and authenticates users through the operating system account.
Report GRANT and REVOKE activity
# 4. Report GRANT and REVOKE activity
psql --port=5432 --username=postgres -d auditing -c "
SELECT
    log_time,
    user_name,
    database_name,
    command_tag,
    message,
    query
FROM postgres_log
WHERE message ILIKE '%GRANT%'
   OR message ILIKE '%REVOKE%'
ORDER BY log_time DESC;
"Group GRANT and REVOKE activity
# 5. Group GRANT and REVOKE activity
psql --port=5432 --username=postgres -d auditing -c "
SELECT
    CASE
        WHEN message ILIKE '%GRANT%' THEN 'GRANT'
        WHEN message ILIKE '%REVOKE%' THEN 'REVOKE'
    END AS audit_action,
    count(*) AS total
FROM postgres_log
WHERE message ILIKE '%GRANT%'
   OR message ILIKE '%REVOKE%'
GROUP BY 1
ORDER BY total DESC;
"Report DDL activity
# 6. Report DDL activity
psql --port=5432 --username=postgres -d auditing -c "
SELECT
    log_time,
    user_name,
    database_name,
    command_tag,
    message
FROM postgres_log
WHERE message ILIKE '%CREATE%'
   OR message ILIKE '%ALTER%'
   OR message ILIKE '%DROP%'
   OR message ILIKE '%COMMENT%'
ORDER BY log_time DESC;
"Report top users generating audit events
# 7. Report top users generating audit events
psql --port=5432 --username=postgres -d auditing -c "
SELECT
    user_name,
    count(*) AS total_audit_events
FROM postgres_log
GROUP BY user_name
ORDER BY total_audit_events DESC;
"Identify suspicious or failed activity
# 8. Identify suspicious or failed activity
psql --port=5432 --username=postgres -d auditing -c "
SELECT
    log_time,
    user_name,
    error_severity,
    message,
    query
FROM postgres_log
WHERE error_severity IN ('ERROR', 'FATAL', 'PANIC')
ORDER BY log_time DESC;
"Report slow queries and duration events
# 9. Report slow queries and duration events
psql --port=5432 --username=postgres -d auditing -c "
SELECT
    log_time,
    user_name,
    message
FROM postgres_log
WHERE message ILIKE 'duration:%'
ORDER BY log_time DESC;
"
Limitations of Native PostgreSQL Auditing
Limitations of Native PostgreSQL Auditing
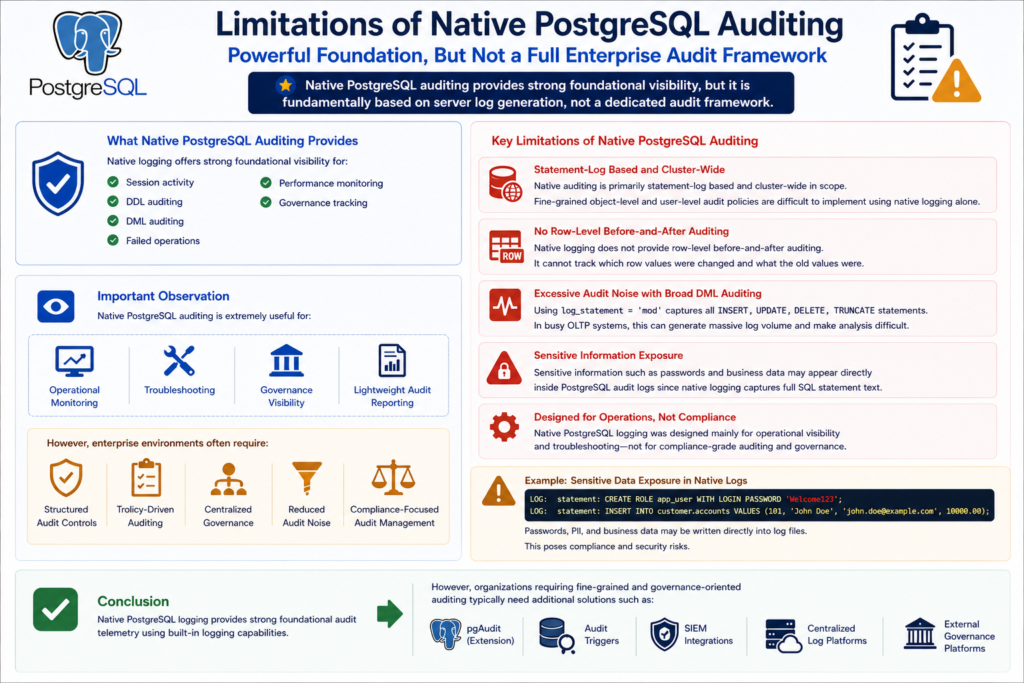
Native PostgreSQL auditing provides strong foundational visibility for:
- session activity
- DDL auditing
- DML auditing
- failed operations
- performance monitoring
- governance tracking
However, native auditing is still fundamentally based on PostgreSQL server log generation rather than a dedicated enterprise audit framework.
Key Limitations
- Native auditing is primarily statement-log based and cluster-wide in scope.
- Fine-grained object-level and user-level audit policies are difficult to implement using native logging alone.
- Native logging does not provide row-level before-and-after auditing.
- Broad DML auditing using
log_statement = 'mod'can generate excessive audit noise in busy OLTP environments. - Sensitive information such as passwords and business data may appear directly inside PostgreSQL audit logs.
- Native PostgreSQL logging was designed mainly for operational visibility and troubleshooting rather than compliance-grade auditing.
Important Observation
Native PostgreSQL auditing is extremely useful for:
- operational monitoring
- troubleshooting
- governance visibility
- lightweight audit reporting
However, enterprise environments often require:
- structured audit controls
- policy-driven auditing
- centralized governance
- reduced audit noise
- compliance-focused audit management
Conclusion
Native PostgreSQL logging provides strong foundational audit telemetry using built-in logging capabilities.
However, organizations requiring fine-grained and governance-oriented auditing typically need additional solutions such as pgAudit, audit triggers, SIEM integrations, or external governance platforms.
Introducing pgAudit for Enterprise Auditing
Introducing pgAudit for Enterprise Auditing
What is pgAudit?
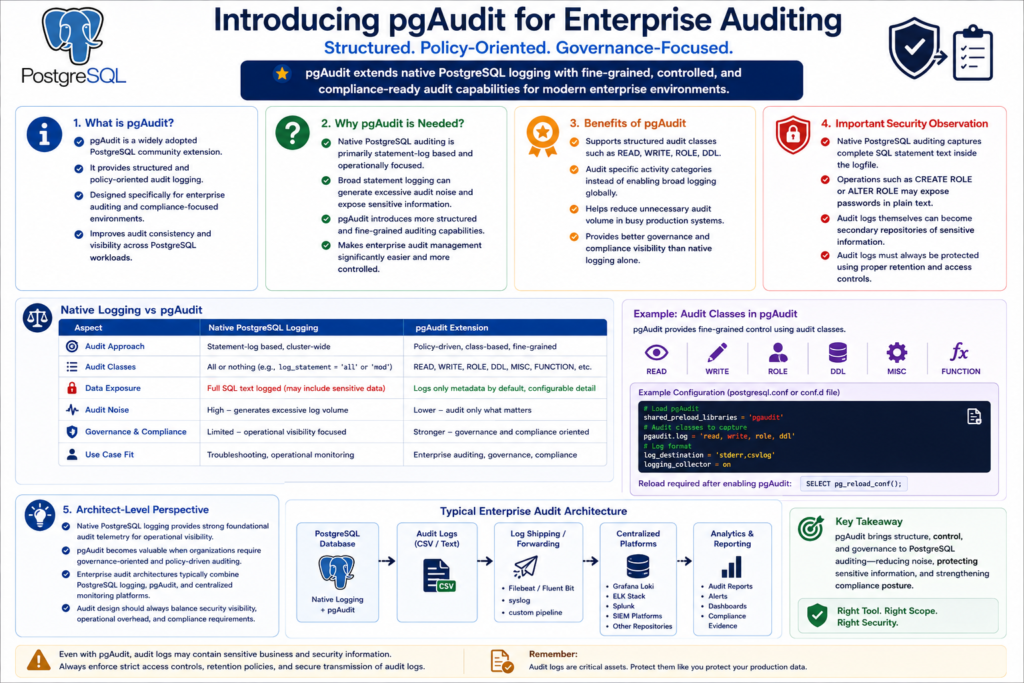
- pgAudit is a widely adopted PostgreSQL community extension that provides structured and policy-oriented audit logging capabilities.
- It extends native PostgreSQL logging with more controlled and governance-focused auditing features.
- pgAudit is designed specifically for enterprise auditing and compliance-oriented environments.
- It helps improve audit consistency and visibility across PostgreSQL workloads.
Why pgAudit is Needed?
- Native PostgreSQL auditing is primarily statement-log based and operationally focused.
- Broad statement logging can generate excessive audit noise and expose sensitive information.
- pgAudit introduces more structured and fine-grained auditing capabilities.
- This makes enterprise audit management significantly easier and more controlled.
Benefits of pgAudit
- pgAudit supports structured audit classes such as READ, WRITE, ROLE, and DDL.
- Administrators can audit specific activity categories instead of enabling broad logging globally.
- This helps reduce unnecessary audit volume in busy production systems.
- pgAudit provides better governance and compliance visibility than native logging alone.
Important Security Observation
- Native PostgreSQL auditing captures complete SQL statement text inside the logfile.
- Operations such as
CREATE ROLEorALTER ROLEmay expose passwords in plain text. - Audit logs themselves can become secondary repositories of sensitive information.
- Audit logs must always be protected using proper retention and access controls.
Architect-Level Perspective
- Native PostgreSQL logging provides strong foundational audit telemetry for operational visibility.
- pgAudit becomes valuable when organizations require governance-oriented and policy-driven auditing.
- Enterprise audit architectures typically combine PostgreSQL logging, pgAudit, and centralized monitoring platforms.
- Audit design should always balance security visibility, operational overhead, and compliance requirements.
Oracle Auditing vs Native PostgreSQL Auditing
Oracle Auditing vs Native PostgreSQL Auditing
| Auditing Requirement | Oracle Database | Native PostgreSQL Equivalent | Notes |
|---|---|---|---|
| Session Login/Logout Auditing | AUDIT SESSION; | log_connections = onlog_disconnections = on | PostgreSQL writes session activity to server log files. |
| Audit DDL Statements | AUDIT TABLE; | log_statement = 'ddl' | Captures CREATE, ALTER, DROP, GRANT, REVOKE, COMMENT statements. |
| Audit DML Statements | AUDIT SELECT TABLE, INSERT TABLE, UPDATE TABLE, DELETE TABLE BY user BY ACCESS; | log_statement = 'mod' | Captures INSERT, UPDATE, DELETE, TRUNCATE and all DDL operations. |
| Capture Failed Statements | AUDIT ... WHENEVER NOT SUCCESSFUL; | log_min_error_statement = error | PostgreSQL logs failed SQL statements automatically at ERROR level and above. |
| Policy-Based Auditing | Fine-Grained Auditing (FGA), Unified Audit Policies | Not available in native PostgreSQL logging | Requires pgAudit or custom trigger-based auditing for granular policies. |
| Audit Storage Location | Database tables + OS audit trail | Server log files (stderr, csvlog) | PostgreSQL native auditing is log-file driven. |
| Structured Audit Format | Unified Audit Trail | csvlog | PostgreSQL CSV logs can be queried and integrated with SIEM platforms. |
| Long Running Query Monitoring | V$SESSION_LONGOPS | log_min_duration_statement = 500ms | PostgreSQL logs queries exceeding configured execution duration. |
| Lock Wait Auditing | V$SESSION_WAIT, V$LOCK | log_lock_waits = on | Logs sessions waiting on locks beyond deadlock_timeout. |
| Deadlock Detection | Automatic trace file generation | deadlock_timeout = '1s' | PostgreSQL logs detected deadlocks into server logs. |
| Blocking Session Analysis | V$SESSION_BLOCKERS, V$LOCK | PostgreSQL logs + pg_stat_activity | Native logging provides wait diagnostics but not Oracle-style wait views. |
| Real-Time Wait Monitoring | V$SESSION_WAIT, V$SYSTEM_EVENT | pg_stat_activity, log files | PostgreSQL monitoring is more view/statistics oriented than audit-policy oriented. |
| User-Specific Auditing | AUDIT ... BY username | Not available natively | Requires pgAudit role-based configuration or trigger-based auditing. |
| Row-Level Auditing | Fine-Grained Auditing (FGA) | Trigger-based auditing | Native PostgreSQL logging does not capture row images automatically. |
Next in the Series: Practical pgAudit Hands-on Labs
- This chapter focused on understanding the limitations of native PostgreSQL auditing and the role of pgAudit in enterprise environments.
- In the upcoming series, we will move into hands-on pgAudit implementation, configuration, and real-world auditing scenarios.
- The pgAudit lab chapters will cover session auditing, object auditing, audit classes, and compliance-focused audit strategies.
- Stay tuned for the upcoming practical pgAudit hands-on labs and enterprise auditing demonstrations.
Database Auditing Using pgAudit
Please visit the page to read about pgAudit.